0x00 前言
Prometheus 主要用于应用服务的监控,尤其是基于 Docker/Kubernetes 部署的应用服务,这里的监控是服务层面的(细粒度),以 Golang 开发的服务为例,如 runtime 信息,接口延迟,某个操作的延迟及接口调用成功率等等,只要是能够收集的信息,都可以作为 Prometheus 的监控指标。
0x01 应用接入
Prometheus 的应用接入其实并不复杂,通常按照如下几个步骤来完成:
- 实现定好需要采集哪些指标,如成功率,延迟,分布数据等
- 将指标转换为 Prometheus 的 Metrics 类型
- 在代码逻辑中加入 Metrics 的 “打点” 调用
- 启动 PrometheusHttp 服务,暴露自己的采集的指标
以上几步即可完成在项目应用中将指标暴露给 Prometheus。
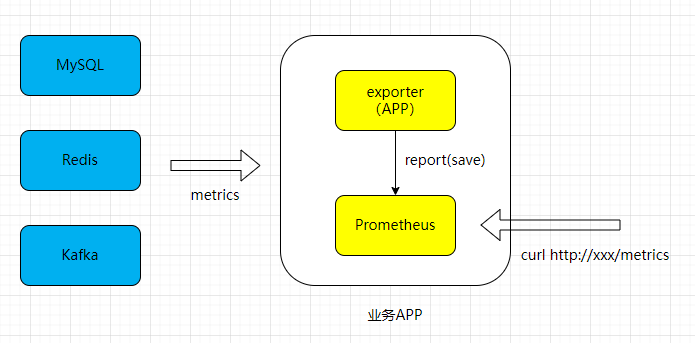
0x02 Exporter 简介
Exporter 是一个采集监控数据并通过 Prometheus 监控规范对外提供数据的组件,它负责从目标处(Your 服务)搜集数据,并将其转化为 Prometheus 支持的格式。Prometheus 会周期性地调用 Exporter 提供的 metrics 数据接口来获取数据。那么使用 Exporter 的好处是什么?
举例来说,如果要监控 Mysql/Redis 等数据库,我们必须要调用它们的接口来获取信息(前提要有),这样每家都有一套接口,这样非常不通用。所以 Prometheus 做法是每个软件做一个 Exporter,Prometheus 的 Http 读取 Exporter 的信息(将监控指标进行统一的格式化并暴露出来)。简单类比,Exporter 就是个翻译,把各种语言翻译成一种统一的语言。
0x03 Build Your Own Exportor
官方文档 WRITING EXPORTERS 介绍了编写 Exportor 的一些注意点。Prometheus 的 client 库提供了实现自定义 Exportor 的 接口,Collector 接口定义了两个方法 Describe 和 Collect,实现这两个方法就可以暴露自定义的数据:
Describe 接口
实现 Describe 接口,传递指标描述符到 channel
// Describe simply sends the two Descs in the struct to the channel.
func (c *ClusterManager) Describe(ch chan<- *prometheus.Desc) {
    ch <- c.OOMCountDesc
    ch <- c.RAMUsageDesc
}
Collect 接口
Collect 函数将执行抓取函数并返回数据,返回的数据传递到 channel 中,并且传递的同时绑定原先的指标描述符。实现指标采集的工作需要在这里完成(针对开发者)
type Collector interface {
	// Describe sends the super-set of all possible descriptors of metrics
	// collected by this Collector to the provided channel and returns once
	// the last descriptor has been sent. The sent descriptors fulfill the
	// consistency and uniqueness requirements described in the Desc
	// documentation.
	//
	// It is valid if one and the same Collector sends duplicate
	// descriptors. Those duplicates are simply ignored. However, two
	// different Collectors must not send duplicate descriptors.
	//
	// Sending no descriptor at all marks the Collector as “unchecked”,
	// i.e. no checks will be performed at registration time, and the
	// Collector may yield any Metric it sees fit in its Collect method.
	//
	// This method idempotently sends the same descriptors throughout the
	// lifetime of the Collector. It may be called concurrently and
	// therefore must be implemented in a concurrency safe way.
	//
	// If a Collector encounters an error while executing this method, it
	// must send an invalid descriptor (created with NewInvalidDesc) to
	// signal the error to the registry.
	Describe(chan<- *Desc)
	// Collect is called by the Prometheus registry when collecting
	// metrics. The implementation sends each collected metric via the
	// provided channel and returns once the last metric has been sent. The
	// descriptor of each sent metric is one of those returned by Describe
	// (unless the Collector is unchecked, see above). Returned metrics that
	// share the same descriptor must differ in their variable label
	// values.
	//
	// This method may be called concurrently and must therefore be
	// implemented in a concurrency safe way. Blocking occurs at the expense
	// of total performance of rendering all registered metrics. Ideally,
	// Collector implementations support concurrent readers.
	Collect(chan<- Metric)
}
暴露 Exportor 及 Promhttp 启动
使用下面的代码将自定义的 Metrics 暴露出去,这也是 promhttp 的通用做法了:
import (
    "log"
    "net/http"
    "github.com/prometheus/client_golang/prometheus/promhttp"
)

func main() {
    http.Handle("/metrics", promhttp.Handler())
    log.Fatal(http.ListenAndServe(":8080", nil))
}
0x04 一个完整的例子
本小节给出一个完整的 Exportor 例子,结构和接口的使用方法可以参考 GODOC。 需要引入的 package:
import (
   "net/http"
   "github.com/prometheus/client_golang/prometheus/promhttp"
   "github.com/prometheus/common/log"
   "github.com/prometheus/client_golang/prometheus"
)
封装了 fooCollector,采集两个指标 fooMetric 和 barMetric:
type fooCollector struct {
   fooMetric *prometheus.Desc
   barMetric *prometheus.Desc
}
初始化 newFooCollector,注意 prometheus.NewDesc 的参数,推荐还是传入 help 及 label 信息:
func newFooCollector() *fooCollector {
   m1 := make(map[string]string)
   m1["env"] = "prod"
   v := []string{"hostname"}
   return &fooCollector{
      fooMetric: prometheus.NewDesc("fff_metrics","Show metrics a for mysql",nil,nil),
      barMetric:prometheus.NewDesc("bbb_metrics","Show metrics a bar occu",v,m1),
   }
}
实现 Describe 及 Collect 方法:
func (collect *fooCollector) Describe(ch chan <- *prometheus.Desc) {
   ch <- collect.barMetric
   ch <- collect.fooMetric

}

func (collect *fooCollector) Collect(ch chan<- prometheus.Metric) {
   var metricValue float64

   if 1 == 1 {
      metricValue = 1
   }


   ch <- prometheus.MustNewConstMetric(collect.fooMetric,prometheus.GaugeValue, metricValue)
   ch <- prometheus.MustNewConstMetric(collect.barMetric,prometheus.CounterValue, metricValue,"kk")
}
最后一个步骤,注册 fooCollector 及启动 promhttp 服务,以上几步就实现了一个简单的 Exportor
func main() {
   foo := newFooCollector()
   prometheus.MustRegister(foo)
   log.Info("beging to server on Port: 18080")
   http.Handle("/metrics",promhttp.Handler())
   log.Fatal(http.ListenAndServe(":18080",nil))
}
0x05 抽象 Exportor 的实现步骤
1、定义指标及初始化方法
定义指标就是创建指标的描述符,通常把要采集的指标描述符放在一个结构体里,如下我们定义了一个指标 fooCollector,其中包含了两种类型的数据 fooMetric 和 barMetric:
//Define a struct for you collector that contains pointers
//to prometheus descriptors for each metric you wish to expose.
//Note you can also include fields of other types if they provide utility
//but we just won't be exposing them as metrics.
type fooCollector struct {
	fooMetric *prometheus.Desc
	barMetric *prometheus.Desc
}
初始化方法 newFooCollector 用于初始化 fooCollector,包含对每个成员 prometheus.Desc 类型的初始化,prometheus.NewDesc 方法创建一个 prometheus.Desc 对象:
//You must create a constructor for you collector that
//initializes every descriptor and returns a pointer to the collector
// 调用工厂方法即可创建一个结构体的实例
func newFooCollector() *fooCollector {
	return &fooCollector{
		fooMetric: prometheus.NewDesc("foo_metric",
			"Shows whether a foo has occurred in our cluster",
			nil, nil,
		),
		barMetric: prometheus.NewDesc("bar_metric",
			"Shows whether a bar has occurred in our cluster",
			nil, nil,
		),
	}
}
2、实现数据采集(核心) 数据采集需要实现 Collector 的两个接口:
Describe:告诉prometheus我们定义了哪些prometheus.Desc结构,通过channel传递给上层Collect:真正实现数据采集的功能,将采集数据结果通过 channel 传递给上层
注意:Collect 中完成的就是每个指标的采集,必须保证这里的数据是动态更新的,每一次调用 curl http://127.0.0.1:8080/metrics 都会触发对 Collect 方法的调用
//Each and every collector must implement the Describe function.
//It essentially writes all descriptors to the prometheus desc channel.
func (collector *fooCollector) Describe(ch chan<- *prometheus.Desc) {
	//Update this section with the each metric you create for a given collector
	ch <- collector.fooMetric
	ch <- collector.barMetric
}

//Collect implements required collect function for all promehteus collectors
func (collector *fooCollector) Collect(ch chan<- prometheus.Metric) {
	//Implement logic here to determine proper metric value to return to prometheus
	//for each descriptor or call other functions that do so.
	var metricValue float64
	if 1 == 1 {
		metricValue = 1
	}

	fmt.Println("start Collect")

	//Write latest value for each metric in the prometheus metric channel.
	//Note that you can pass CounterValue, GaugeValue, or UntypedValue types here.
	ch <- prometheus.MustNewConstMetric(collector.fooMetric, prometheus.CounterValue, metricValue)
	ch <- prometheus.MustNewConstMetric(collector.barMetric, prometheus.CounterValue, metricValue)
}
注意:每次调用curl http://127.0.0.1:8080/metrics时,都会触发一次已注册MustRegister到Prometheus指标的Collect方法的调用,注册了多少个指标,都会调用其Collect方法
3、注册指标及启动 promHTTP 服务
这里在主函数中注册上面自定义的指标,注册成功之后,启动 HTTP 服务器,这样就完成了自定义的 Exportor 服务。
func main() {
    //Create a new instance of the foocollector and
    //register it with the prometheus client.
    foo := newFooCollector()
    prometheus.MustRegister(foo)

    //This section will start the HTTP server and expose
    //any metrics on the /metrics endpoint.
    http.Handle("/metrics", promhttp.Handler())
    log.Info("Beginning to serve on port :8080")
    log.Fatal(http.ListenAndServe(":8080", nil))
}
4、最后,通过curl http://127.0.0.1:8080/metrics即可查看暴露的指标
# HELP bar_metric Shows whether a bar has occurred in our cluster
# TYPE bar_metric gauge
bar_metric 0.07074170776466579 1720775972352
# HELP foo_metric Shows whether a foo has occurred in our cluster
# TYPE foo_metric gauge
foo_metric 0.07074170776466579 1720772372352
0x06 一个实践例子:sarama
使用sarama库,由于其内置的指标实现是基于github.com/rcrowley/go-metrics库的,现在想把其转换为Prometheus的格式,如何实现?
参考saramaprom的做法,这里简单分析下其实现。
1、调用方法如下,把sarama的cfg.MetricRegistry作为参数传入saramaprom.ExportMetrics方法
ctx := context.Background()
cfg := sarama.NewConfig()
err := saramaprom.ExportMetrics(ctx, cfg.MetricRegistry, saramaprom.Options{
	Label: "some name to distinguish between different sarama instances",
})
2、customCollector实现
// for collecting prometheus.constHistogram objects
type customCollector struct {
	prometheus.Collector

	metric prometheus.Metric
	mutex  *sync.Mutex
}

func newCustomCollector(mu *sync.Mutex) *customCollector {
	return &customCollector{
		mutex: mu,
	}
}

func (c *customCollector) Collect(ch chan<- prometheus.Metric) {
	c.mutex.Lock()
	if c.metric != nil {
		val := c.metric
		ch <- val
	}
	c.mutex.Unlock()
}

func (c *customCollector) Describe(_ chan<- *prometheus.Desc) {
	// empty method to fulfill prometheus.Collector interface
}
3、exporter结构
type exporter struct {
	opt              Options
	registry         MetricsRegistry
	promRegistry     prometheus.Registerer
	gauges           map[string]prometheus.Gauge
	customMetrics    map[string]*customCollector	//可能有多个customCollector
	histogramBuckets []float64
	timerBuckets     []float64		//time bucket
	mutex            *sync.Mutex
}
4、初始化exporter时,会异步启动收集&&转换逻辑,这也是本项目的核心逻辑,主要目的是定时把go-metrics的格式转换为Prometheus的格式
- 通过
c.registry.Each方法,定时从sarama库暴露的指标收集所有的数据 - 按照metrics的类型,将其转换为Prometheus的标准格式,
gaugeFromNameAndValue和gaugeFromNameAndValue
func (c *exporter) update() error {
	var err error
	c.registry.Each(func(name string, i interface{}) {
		switch metric := i.(type) {
		case metrics.Counter:
			err = c.gaugeFromNameAndValue(name, float64(metric.Count()))
		case metrics.Gauge:
			err = c.gaugeFromNameAndValue(name, float64(metric.Value()))
		case metrics.GaugeFloat64:
			err = c.gaugeFromNameAndValue(name, float64(metric.Value()))
		case metrics.Histogram: // sarama
			samples := metric.Snapshot().Sample().Values()
			if len(samples) > 0 {
				lastSample := samples[len(samples)-1]
				err = c.gaugeFromNameAndValue(name, float64(lastSample))
			}
			if err == nil {
				err = c.histogramFromNameAndMetric(name, metric, c.histogramBuckets)
			}
		case metrics.Meter: // sarama
			lastSample := metric.Snapshot().Rate1()
			err = c.gaugeFromNameAndValue(name, float64(lastSample))
		case metrics.Timer:
			lastSample := metric.Snapshot().Rate1()
			err = c.gaugeFromNameAndValue(name, float64(lastSample))
			if err == nil {
				err = c.histogramFromNameAndMetric(name, metric, c.timerBuckets)
			}
		}
	})
	return err
}
5、gaugeFromNameAndValue的实现,这个是直接通过指标暴露
func (c *exporter) gaugeFromNameAndValue(name string, val float64) error {
	shortName, labels, skip := c.metricNameAndLabels(name)
	if skip {
		if c.opt.Debug {
			fmt.Printf("[saramaprom] skip metric %q because there is no broker or topic labels\n", name)
		}
		return nil
	}

	if _, exists := c.gauges[name]; !exists {
		// 不存在则新建
		labelNames := make([]string, 0, len(labels))
		for labelName := range labels {
			labelNames = append(labelNames, labelName)
		}

		g := prometheus.NewGaugeVec(prometheus.GaugeOpts{
			Namespace: c.sanitizeName(c.opt.Namespace),
			Subsystem: c.sanitizeName(c.opt.Subsystem),
			Name:      c.sanitizeName(shortName),
			Help:      shortName,
		}, labelNames)

		if err := c.promRegistry.Register(g); err != nil {
			switch err := err.(type) {
			case prometheus.AlreadyRegisteredError:
				var ok bool
				g, ok = err.ExistingCollector.(*prometheus.GaugeVec)
				if !ok {
					return fmt.Errorf("prometheus collector already registered but it's not *prometheus.GaugeVec: %v", g)
				}
			default:
				return err
			}
		}
		c.gauges[name] = g.With(labels)
	}

	//存在就直接set
	c.gauges[name].Set(val)
	return nil
}
6、histogramFromNameAndMetric的实现,与gaugeFromNameAndValue不同的是,该方法是通过exporter的方式暴露的(原因)
func (c *exporter) histogramFromNameAndMetric(name string, goMetric interface{}, buckets []float64) error {
	key := c.createKey(name)
	collector, exists := c.customMetrics[key]
	if !exists {
		collector = newCustomCollector(c.mutex)
		c.promRegistry.MustRegister(collector)
		c.customMetrics[key] = collector
	}

	var ps []float64
	var count uint64
	var sum float64
	var typeName string

	switch metric := goMetric.(type) {
	case metrics.Histogram:
		snapshot := metric.Snapshot()
		ps = snapshot.Percentiles(buckets)
		count = uint64(snapshot.Count())
		sum = float64(snapshot.Sum())
		typeName = "histogram"
	case metrics.Timer:
		snapshot := metric.Snapshot()
		ps = snapshot.Percentiles(buckets)
		count = uint64(snapshot.Count())
		sum = float64(snapshot.Sum())
		typeName = "timer"
	default:
		return fmt.Errorf("unexpected metric type %T", goMetric)
	}

	bucketVals := make(map[float64]uint64)
	for ii, bucket := range buckets {
		bucketVals[bucket] = uint64(ps[ii])
	}

	name, labels, skip := c.metricNameAndLabels(name)
	if skip {
		return nil
	}

	desc := prometheus.NewDesc(
		prometheus.BuildFQName(
			c.sanitizeName(c.opt.Namespace),
			c.sanitizeName(c.opt.Subsystem),
			c.sanitizeName(name)+"_"+typeName,
		),
		c.sanitizeName(name),
		nil,
		labels,
	)

	hist, err := prometheus.NewConstHistogram(desc, count, sum, bucketVals)
	if err != nil {
		return err
	}
	c.mutex.Lock()
	collector.metric = hist	//存储在一个map中,value为collector类型
	c.mutex.Unlock()
	return nil
}
其他实现:
0x07 总结
本篇文章分析了 Prometheus 在应用中的接入方法及实现的步骤。