0x00 前言
pprof 是 Go 的性能分析工具,在程序运行过程中,可以记录程序的运行信息,如 CPU 使用情况、内存使用情况、goroutine 运行情况等。分析性能需要结合具体的场景来看
性能指标
- 吞吐量:每秒钟可以处理的请求数
- 响应时间:从客户端发出请求,到收到回包的总耗时
- 内存使用率
- CPU 使用率
- IO 使用率
0x01 工具介绍
golang 可通过 benchmark 加 pprof 来定位具体的性能瓶颈。
工具 1:benchmark
常用指令:go test -v some_code_test.go -run=none -bench=. -benchtime=3s -cpuprofile cpu.prof -memprofile mem.prof
-run:单次测试,一般用于代码逻辑验证-bench=.:执行所有 Benchmark,也可以通过用例函数名来指定部分测试用例-benchtime:指定测试执行时长-cpuprofile: 输出 cpu 的 pprof 信息文件-memprofile:输出 heap 的 pprof 信息文件-blockprofile:阻塞分析,记录 goroutine 阻塞等待同步(包括定时器通道)的位置-mutexprofile:互斥锁分析,报告互斥锁的竞争情况
benchmark 测试用例常用函数
b.ReportAllocs():输出单次循环使用的内存数量和对象allocs信息b.RunParallel():使用协程并发测试b.SetBytes(n int64):设置单次循环使用的内存数量
1、示例一
func BenchmarkSprintf(b *testing.B){
	num:=10
	b.ResetTimer()
	for i:=0;i<b.N;i++{
		fmt.Sprintf("%d",num)
	}
}
输出如下,-8表示运行时GOMAXPROCS的值,接着的20000000表示运行for循环的次数,即调用被测试代码的次数,最后的117 ns/op表示每次耗时117ns。以上是测试时间默认是1秒,也就是1s调用2000w次,单次消耗117ns
//go test -bench=. -run=none
BenchmarkSprintf-8      20000000               117 ns/op
PASS
ok      xxxx       2.474s
2、示例二
通过benchmark对比不同实现的性能,指令为go test -bench=. -benchmem -run=none,加入-benchmem显示每次操作分配内存的次数,以及每次操作分配的字节数:
func BenchmarkSprintf(b *testing.B){
	num:=10
	b.ResetTimer()
	for i:=0;i<b.N;i++{
		fmt.Sprintf("%d",num)
	}
}

func BenchmarkFormat(b *testing.B){
	num:=int64(10)
	b.ResetTimer()
	for i:=0;i<b.N;i++{
		strconv.FormatInt(num,10)
	}
}

func BenchmarkItoa(b *testing.B){
	num:=10
	b.ResetTimer()
	for i:=0;i<b.N;i++{
		strconv.Itoa(num)
	}
}
输出如下,看起来内存分配是导致性能差异的原因:)
//go test -bench=. -benchmem -run=none
BenchmarkSprintf-8      20000000               110 ns/op              16 B/op          2 allocs/op
BenchmarkFormat-8       50000000                31.0 ns/op             2 B/op          1 allocs/op
BenchmarkItoa-8         50000000                33.1 ns/op             2 B/op          1 allocs/op
PASS
ok      xxxxx       5.610s
【重要】工具 2:pprof
生成方式
runtime/pprof: 手动调用如runtime.StartCPUProfile或者runtime.StopCPUProfile等 API 来生成和写入采样文件,灵活性高。主要用于本地测试net/http/pprof: 通过 http 服务(主代码内嵌)获取 Profile 采样文件,适用于对应用程序的整体监控。通过runtime/pprof实现。主要用于服务器端测试go test: 通过go test -bench . -cpuprofile cpuprofile.out生成采样文件,主要用于本地基准测试。可用于重点测试某些函数
注意,使用 pprof 采样内存时,常用 inuse_space 类型,此外,pprof 生成内存的 svg 调用流程图,可以得到前后调用关系的调用栈图,同时还包括每一层的 inuse 内存大小,文件名,函数,到下一层的内存大小,这样就可以非常直观的知道在哪层泄漏了内存:)
取样频率
| 指标 | 说明 | 取样频率 |
|---|---|---|
| goroutine | 活跃 Goroutine 的信息的记录 | 仅在获取时取样一次 |
| threadcreate | 系统线程创建情况的记录 | 仅在获取时取样一次 |
| heap | 堆内存分配情况的记录 | 默认每分配 512K 字节时取样一次 |
| block | Goroutine 阻塞事件的记录 | 默认每发生一次阻塞事件时取样一次 |
go tool pprof http://ip:port/debug/pprof/goroutine
go tool pprof http://ip:port/debug/pprof/heap
查看方式
常用指令 1:go tool pprof [options] [binary] -o xxxx
输出格式: 一般常用的是:
–text:纯文本–web:生成 svg 并用浏览器打开(如果 svg 的默认打开方式是浏览器)–svg:只生成 svg–list funcname:筛选出正则匹配 funcname 的函数的信息-http=":port":直接本地浏览器打开 profile 查看(包括 top,graph,火焰图等)
常用指令 2:go tool pprof -base profile1 profile2,该指令意义为对比查看 2 个 profile,一般用于代码修改前后对比,定位差异点
命令行方式:通过命令行方式查看 profile 时,通常使用指令:
1)、topN [-cum] 查看前 N 个数据
flat  flat%   sum%        cum   cum%
5.95s 27.56% 27.56%      5.95s 27.56%  runtime.usleep
4.97s 23.02% 50.58%      5.08s 23.53%  sync.(*RWMutex).RLock
4.46s 20.66% 71.24%      4.46s 20.66%  sync.(*RWMutex).RUnlock
2.69s 12.46% 83.70%      2.69s 12.46%  runtime.pthread_cond_wait
1.50s  6.95% 90.64%      1.50s  6.95%  runtime.pthread_cond_signal
字段的意义为:
| 字段 | 意义 |
|---|---|
| flat | 采样时,该函数正在运行的次数 * 采样频率(10ms),即得到估算的函数运行采样时间。这里不包括函数等待子函数返回 |
| flat% | flat / 总采样时间值 |
| sum% | 前面所有行的 flat% 的累加值,如第三行 sum% = 71.24% = 27.56% + 50.58% |
| cum | 采样时,该函数出现在调用堆栈的采样时间,包括函数等待子函数返回。因此 flat <= cum |
| cum% | cum / 总采样时间值 |
2)、list funcname: 查看某个函数的详细信息,可以明确具体的资源(cpu,内存等)是由哪一行触发的
工具3:火焰图的使用
火焰图怎么看?下面是一个简化的火焰图例子(假设是 CPU 性能)。首先,CPU 抽样得到了三个调用栈,下面代码中,start_thread 是启动线程,调用了 func_a。后者又调用了 func_b 和 func_d,而 func_b 又调用了 func_c。
func_c
func_b
func_a
start_thread

func_d
func_a
start_thread

func_d
func_a
start_thread
经过合并处理后,得到了下面的结果,即存在两个调用栈,第一个调用栈抽中 1 次,第二个抽中 2 次。有了这个调用栈统计,生成 SVG 图片如下:
start_thread;func_a;func_b;func_c 1
start_thread;func_a;func_d 2
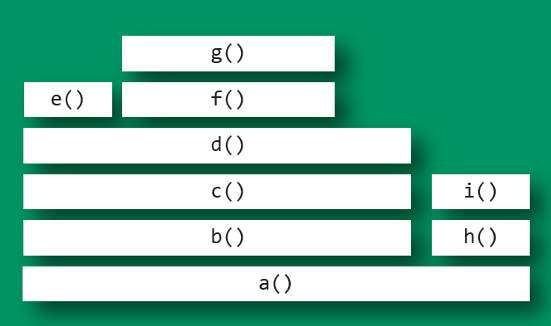
上面图片中,最顶层的函数 g() 占用 CPU 时间最多。d() 的宽度最大,但是它直接耗用 CPU 的部分很少。b() 和 c() 没有直接消耗 CPU(长度相等)。因此,如果要调查性能问题,首先应该调查 g(),其次是 i();另外,从图中可知 a() 有两个分支 b() 和 h(),这表明 a() 里面可能有一个条件语句,而 b() 分支消耗的 CPU 大大高于 h()。
工具 4:GCTRACE
Golang自带 gc,在不改动代码的情况下,可以通过设置GODEBUG='gctrace=1'环境变量启动程序,来向标准错误输出打印 gc log。gc 后面的数字表示是第几次 gc,@后面的数字表示程序启动经历的时间,后面几项和 gc 消耗的 cpu 时间有关,在分析 gc 导致的程序 hang 时很有用(要看下倒数第 2、3 项)
gc 21 @8.389s 0%: 0.069+4.0+0.16 ms clock, 1.6+2.8/14/10+4.0 ms cpu, 87->88->45 MB, 89 MB goal, 24 P
gc 22 @8.919s 0%: 0.053+3.7+0.63 ms clock, 1.0+1.9/16/12+12 ms cpu, 87->88->44 MB, 90 MB goal, 24 P
gc 23 @9.431s 0%: 0.055+3.9+0.18 ms clock, 1.3+2.6/15/13+4.5 ms cpu, 87->88->45 MB, 89 MB goal, 24 P
gc 24 @9.948s 0%: 0.093+6.0+1.1 ms clock, 2.2+2.3/18/5.6+27 ms cpu, 87->88->44 MB, 90 MB goal, 24 P
gc 25 @10.108s 0%: 0.026+10+0.55 ms clock, 0.63+0/12/15+13 ms cpu, 88->89->66 MB, 89 MB goal, 24 P
gc 26 @10.407s 0%: 0.023+23+0.57 ms clock, 0.56+0/41/3.3+13 ms cpu, 178->178->133 MB, 179 MB goal, 24 P
gc 27 @10.792s 0%: 0.024+45+0.58 ms clock, 0.58+0/63/2.5+14 ms cpu, 282->282->222 MB, 283 MB goal, 24 P
gc 28 @11.560s 0%: 0.023+92+0.13 ms clock, 0.55+0/17/100+3.1 ms cpu, 520->520->399 MB, 521 MB goal, 24 P
gc 29 @13.113s 0%: 0.035+186+0.53 ms clock, 0.85+0/21/187+12 ms cpu, 997->997->755 MB, 998 MB goal, 24 P
gc 30 @14.490s 0%: 0.035+9.2+0.55 ms clock, 0.84+0.20/18/3.0+13 ms cpu, 858->858->518 MB, 1510 MB goal, 24 P
gc 31 @16.208s 0%: 0.032+381+0.15 ms clock, 0.77+0/400/3.5+3.7 ms cpu, 1610->1610->1466 MB, 1611 MB goal, 24 P
gc 32 @16.841s 0%: 0.024+9.6+0.12 ms clock, 0.59+0.12/15/6.7+3.0 ms cpu, 1488->1489->993 MB, 2932 MB goal, 24 P
gc 33 @22.381s 0%: 0.026+752+0.14 ms clock, 0.64+0/18/760+3.3 ms cpu, 3358->3359->2888 MB, 3359 MB goal, 24 P
gc 34 @23.237s 0%: 0.020+7.7+0.12 ms clock, 0.49+0.14/17/2.0+2.9 ms cpu, 2889->2889->1940 MB, 5776 MB goal, 24 P
gc 35 @34.475s 0%: 0.032+9.9+0.11 ms clock, 0.77+0.65/17/9.3+2.7 ms cpu, 2910->2910->1940 MB, 3881 MB goal, 24 P
gc 36 @34.732s 0%: 0.025+1412+0.13 ms clock, 0.60+0/1422/10+3.2 ms cpu, 5746->5746->5732 MB, 5747 MB goal, 24 P
gc 37 @54.129s 0%: 0.028+9.9+0.12 ms clock, 0.67+0.95/18/11+3.0 ms cpu, 7274->7274->3836 MB, 11464 MB goal, 24 P
gc 38 @59.297s 0%: 0.032+2910+0.13 ms clock, 0.78+0/2920/13+3.2 ms cpu, 11847->11847->11420 MB, 11848 MB goal, 24 P
gc 39 @64.199s 02010.046+29024+0.32 ms clock, 1.1+0/18/3195+7.7 ms cpu, 15532->15532->11577 MB, 22840 MB goal, 24 P
每次 gc circle 完,gc 会根据当前分配的堆内存大小和 GOGC 环境变量,计算下一次 gc 的目标内存大小,如果后面内存使用没有超过这个 goal,就不会触发gc:
#->#-># MB  heap size at GC start, at GC end, and live heap
# MB goal   goal heap size
从上面这个 gc log 我们可以看到从某个时间点开始,内存使用开始猛增,gc 基本没有回收多少内存,所以得采用pprof分析
工具5:压测工具wrk
工具6:番外(实用)
摘自Hi, 使用多年的go pprof检查内存泄漏的方法居然是错的一文,是一个不错的思路。
pprof也可以比较两个时间点的分配的内存的差值,通过比较差值,就容易看到哪些地方产生的内存残留的比较多,没有被内存释放,极有可能是内存泄漏的点。通过下面的方式产生两个时间点的堆的profile,之后使用pprof工具进行分析。
- 首先确保已经配置了pprof的http路径,可以访问
http://ip:port/debug/pprof/查看 - 导出时间点
1的堆的profile:curl -s http://127.0.0.1:8080/debug/pprof/heap > base.heap, 把它作为基准点 - 等待一段时间后导出时间点
2的堆的profile:curl -s http://127.0.0.1:8080/debug/pprof/heap > current.heap - 现在可以比较这两个时间点的堆的差异了,通过
go tool pprof --base base.heap current.heap - 后续操作和正常的
go tool pprof一样, 比如使用top查看使用堆内存最多的几处地方的内存增删情况等
0x02 pprof 实战
prepare
需要准备如下工具:
1、FlameGraph 脚本
git clone https://github.com/brendangregg/FlameGraph.git
cp FlameGraph/flamegraph.pl /usr/local/bin
2、go-torch 工具:生成火焰图,该工具实际上本身读取的也是 pprof 的输出,但根据火焰图的定义进行了展示优化
go get -v github.com/uber/go-torch
3、graphviz
4、wrk:压测工具
服务型
import (
    "log"
    "net/http"
    _ "net/http/pprof"
    "regexp"
)

func handler(wr http.ResponseWriter, r *http.Request) {
    var pattern = regexp.MustCompile(`^(\w+)@didichuxing.com$`)
    account := r.URL.Path[1:]
    res := pattern.FindSubmatch([]byte(account))
    if len(res) > 1 {
        wr.Write(res[1])
    } else {
        wr.Write([]byte("None"))
    }
}

func main() {
    http.HandleFunc("/", handler)
    err := http.ListenAndServe(":9999", nil)
    if err != nil {
        log.Fatal("ListenAndServe:", err)
    }
}
cpu 问题定位
以定位 cpu 消耗问题为例,用 wrk 模拟已经在线上跑的服务的负载情况(时间设置长些):
[root@VM_120_245_centos ~]# wrk -c500 -t30 -d1m http://localhost:9999/abcdefghijklmn@google.com
Running 1m test @ http://localhost:9999/abcdefghijklmn@google.com
  30 threads and 500 connections
  Thread Stats   Avg      Stdev     Max   +/- Stdev
    Latency    28.08ms   39.97ms 570.90ms   84.14%
    Req/Sec     2.60k     0.94k    9.32k    68.25%
  4657006 requests in 1.00m, 532.95MB read
Requests/sec:  77489.92
Transfer/sec:      8.87MB
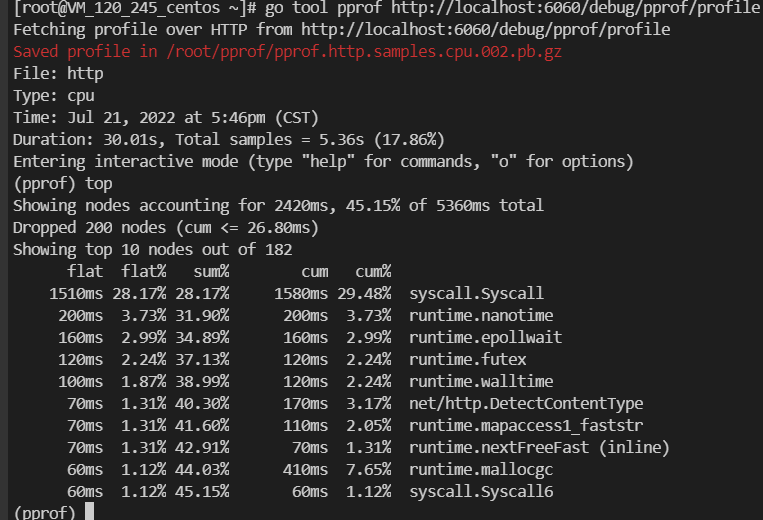
用 go tool pprof localhost:9999/debug/pprof/profile 进行采样,采样完毕之后自动进入 pprof 的交互命令行界面,top 10 可以看到采样期间内 cpu 使用 top 10 的函数:
top指令不一定能直观看到性能瓶颈svg指令生成调用流程图,可以基于 pprof 输出的流程图进行细化分析(pprof 输出的svg图中,耗时长的调用线条会加黑加粗,时间长的函数所在的方块也会被加黑加粗,这里是需要长期经验的累积)- pprof 输出的流程图其实还是比较复杂,尤其是系统本身逻辑比较复杂的时候,图也更复杂,优化的方法就是参考火焰图进行分析
[root@VM_120_245_centos ~/gogogo]# go tool pprof  localhost:9999/debug/pprof/profile
Fetching profile over HTTP from http://localhost:9999/debug/pprof/profile
Saved profile in /root/pprof/pprof.pprof.samples.cpu.007.pb.gz
File: pprof
Type: cpu
Time: Jul 21, 2022 at 8:09pm (CST)
Duration: 30.22s, Total samples = 1.24mins (246.64%)
Entering interactive mode (type "help" for commands, "o" for options)
(pprof) top
Showing nodes accounting for 24.15s, 32.40% of 74.53s total
Dropped 504 nodes (cum <= 0.37s)
Showing top 10 nodes out of 182
      flat  flat%   sum%        cum   cum%
    10.12s 13.58% 13.58%     11.29s 15.15%  syscall.Syscall
     2.21s  2.97% 16.54%     17.48s 23.45%  runtime.mallocgc
     2.01s  2.70% 19.24%      2.01s  2.70%  runtime.nextFreeFast
     1.96s  2.63% 21.87%      4.70s  6.31%  runtime.scanobject
     1.54s  2.07% 23.94%      2.14s  2.87%  runtime.heapBitsSetType
     1.36s  1.82% 25.76%      1.39s  1.87%  runtime.nanotime
     1.35s  1.81% 27.57%      6.12s  8.21%  runtime.growslice
     1.32s  1.77% 29.34%      1.59s  2.13%  runtime.findObject
     1.16s  1.56% 30.90%      1.16s  1.56%  runtime.memclrNoHeapPointers
     1.12s  1.50% 32.40%      1.12s  1.50%  runtime.markBits.isMarked (inline)
(pprof) svg
Generating report in profile001.svg
通过下面命令生成火焰图,注意,该工具需要调用 FlameGraph 提供的脚本(不然会报错),同样的,使用工具必须服务有相应的负载:
go-torch http://localhost:9999/debug/pprof/profile
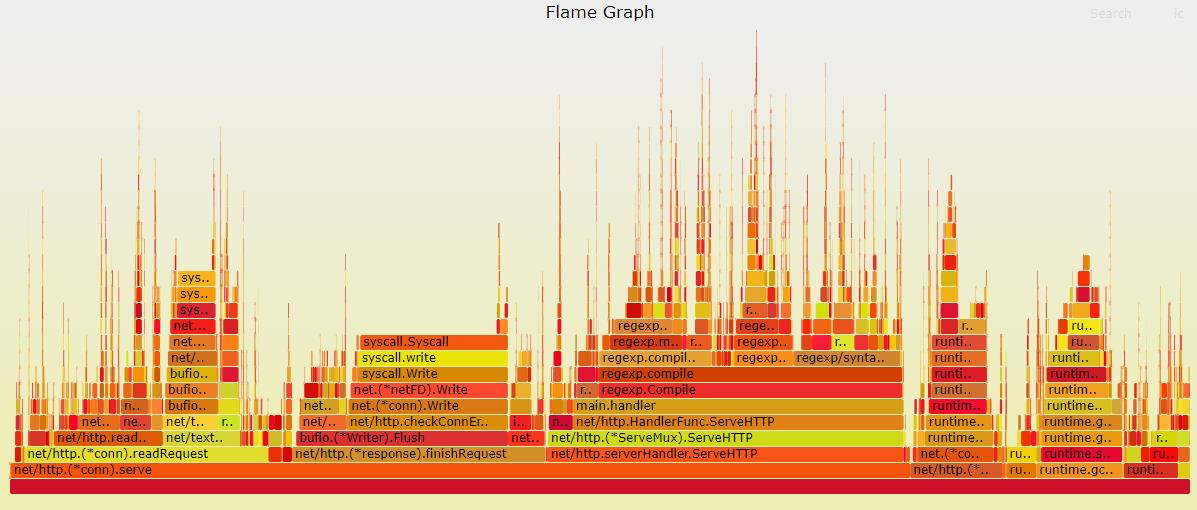
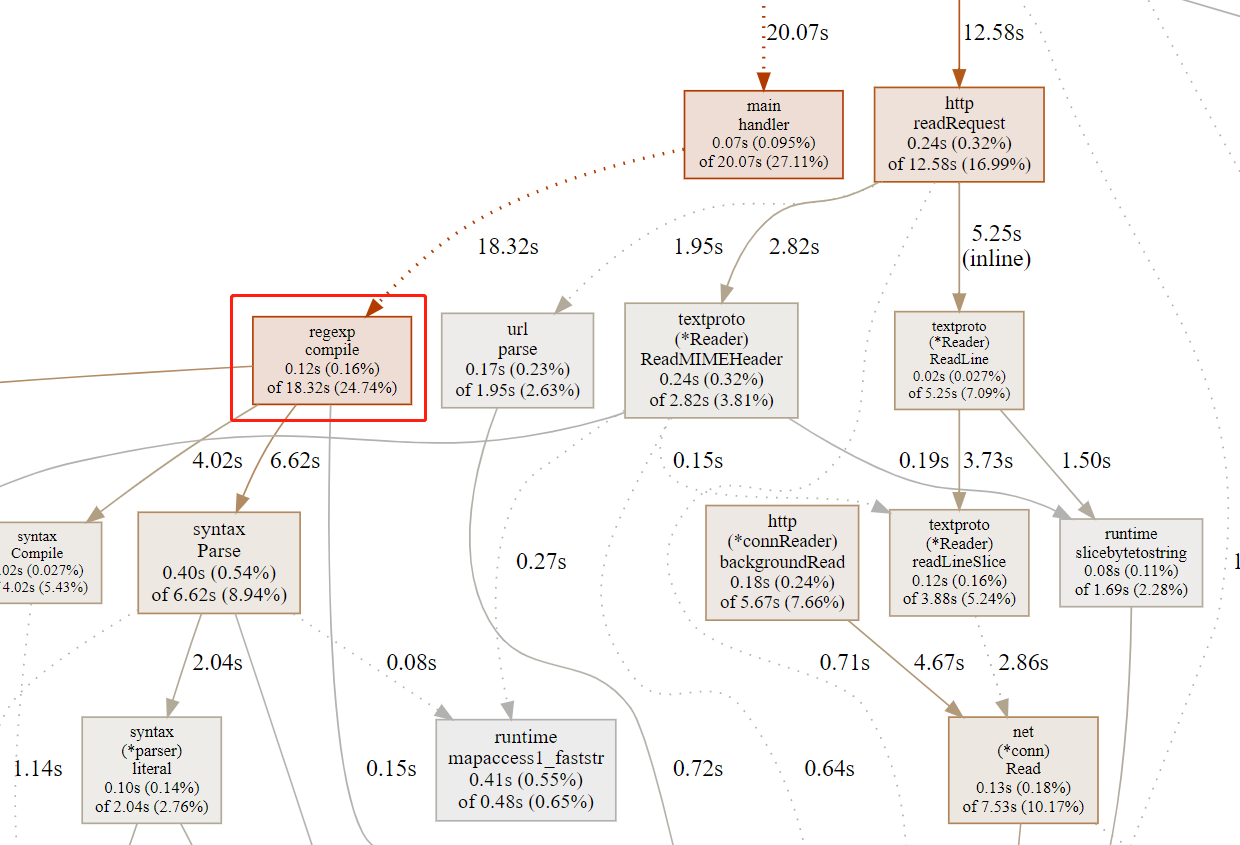
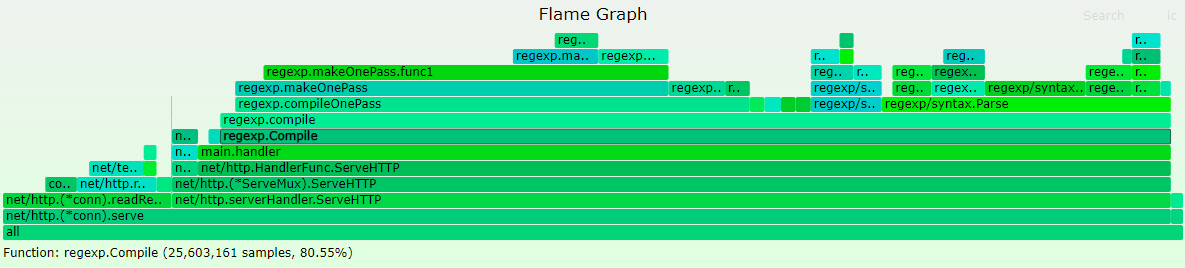
输出火焰图之后我们最主要应该关注的是较宽的这些 ** 平顶山 **,整个程序是从左到右从下到上执行的。不过这里尽是一些 syscall 或者网络的读写,并不能进行多少优化,还是先看自己的业务逻辑部分。这里就比较清晰的定位到原因了:regexp.MustCompile
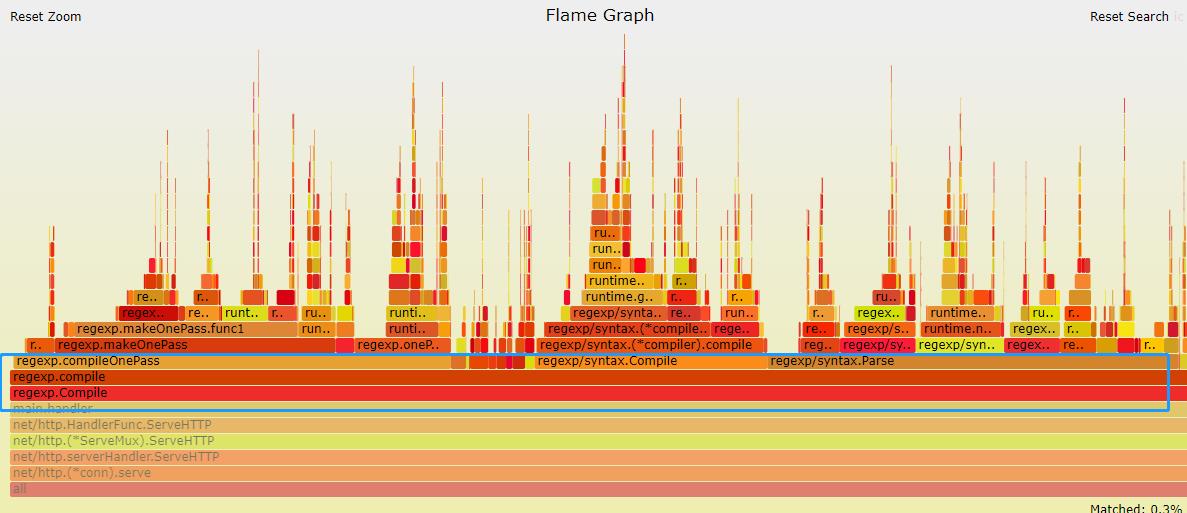
然后再由 regexp.MustCompile 对应的方法 handler,在 pprof 的命令行中使用 list 指令定位,看到下面的 11 行,终于发现了性能瓶颈(可以直观获取 ** 一个函数里每行消耗比较大的调用在整个过程中占用了多少时间,占用了多少百分比 **):
(pprof) list handler
Total: 1.24mins
ROUTINE ======================== main.handler in /root/gogogo/pprof.go
      70ms     20.81s (flat, cum) 27.92% of Total
         .          .      6:    _ "net/http/pprof"
         .          .      7:    "regexp"
         .          .      8:)
         .          .      9:
         .          .     10:func handler(wr http.ResponseWriter, r *http.Request) {
      20ms     19.09s     11:    var pattern = regexp.MustCompile(`^(\w+)@didichuxing.com$`)        // 问题在此
      20ms       20ms     12:    account := r.URL.Path[1:]
      10ms      1.32s     13:    res := pattern.FindSubmatch([]byte(account))
      10ms       10ms     14:    if len(res) > 1 {
      10ms       10ms     15:        wr.Write(res[1])
         .          .     16:    } else {
         .      360ms     17:        wr.Write([]byte("None"))
         .          .     18:    }
         .          .     19:}
         .          .     20:
         .          .     21:func main() {
         .          .     22:    http.HandleFunc("/", handler)
ROUTINE ======================== net/http.(*ServeMux).handler in /usr/local/go/src/net/http/server.go
      10ms      120ms (flat, cum)  0.16% of Total
         .          .   2400:func (mux *ServeMux) handler(host, path string) (h Handler, pattern string) {
         .          .   2401:   mux.mu.RLock()
         .          .   2402:   defer mux.mu.RUnlock()
         .          .   2403:
         .          .   2404:   // Host-specific pattern takes precedence over generic ones
      10ms       10ms   2405:   if mux.hosts {
         .          .   2406:           h, pattern = mux.match(host + path)
         .          .   2407:   }
         .          .   2408:   if h == nil {
         .      100ms   2409:           h, pattern = mux.match(path)
         .          .   2410:   }
         .          .   2411:   if h == nil {
         .          .   2412:           h, pattern = NotFoundHandler(), ""
         .          .   2413:   }
         .       10ms   2414:   return
         .          .   2415:}
         .          .   2416:
         .          .   2417:// ServeHTTP dispatches the request to the handler whose
         .          .   2418:// pattern most closely matches the request URL.
         .          .   2419:func (mux *ServeMux) ServeHTTP(w ResponseWriter, r *Request) {
如何排除网络传输干扰?
内存 / GC 问题定位
内存的统计结果是一个统计值,不需要采样。提供压力采样时间,然后直接运行如下指令即可获取火焰图。内存和 cpu 的火焰图其实差不多,分析过程也类似:
go-torch --alloc_objects -t 5 --colors=mem localhost:9999/debug/pprof/heap
在通过 go tool pprof localhost:9999/debug/pprof/heap 进行 pprof 交互界面,直接就可以定位到内存消耗的问题:
[root@VM_120_245_centos ~/gogogo]# go tool pprof localhost:9999/debug/pprof/heap
Fetching profile over HTTP from http://localhost:9999/debug/pprof/heap
Saved profile in /root/pprof/pprof.pprof.alloc_objects.alloc_space.inuse_objects.inuse_space.004.pb.gz
File: pprof
Type: inuse_space
Time: Jul 21, 2022 at 8:46pm (CST)
Entering interactive mode (type "help" for commands, "o" for options)
(pprof) list handler
Total: 12.03MB
ROUTINE ======================== main.handler in /root/gogogo/pprof.go
0 1MB (flat, cum) 8.32% of Total
. . 6: _ "net/http/pprof"
. . 7: "regexp"
. . 8:)
. . 9:
. . 10:func handler(wr http.ResponseWriter, r *http.Request) {
. 1MB 11: var pattern = regexp.MustCompile(`^(\w+)@didichuxing.com$`)
. . 12: account := r.URL.Path[1:]
. . 13: res := pattern.FindSubmatch([]byte(account))
. . 14: if len(res) > 1 {
. . 15: wr.Write(res[1])
. . 16: } else {
(pprof)
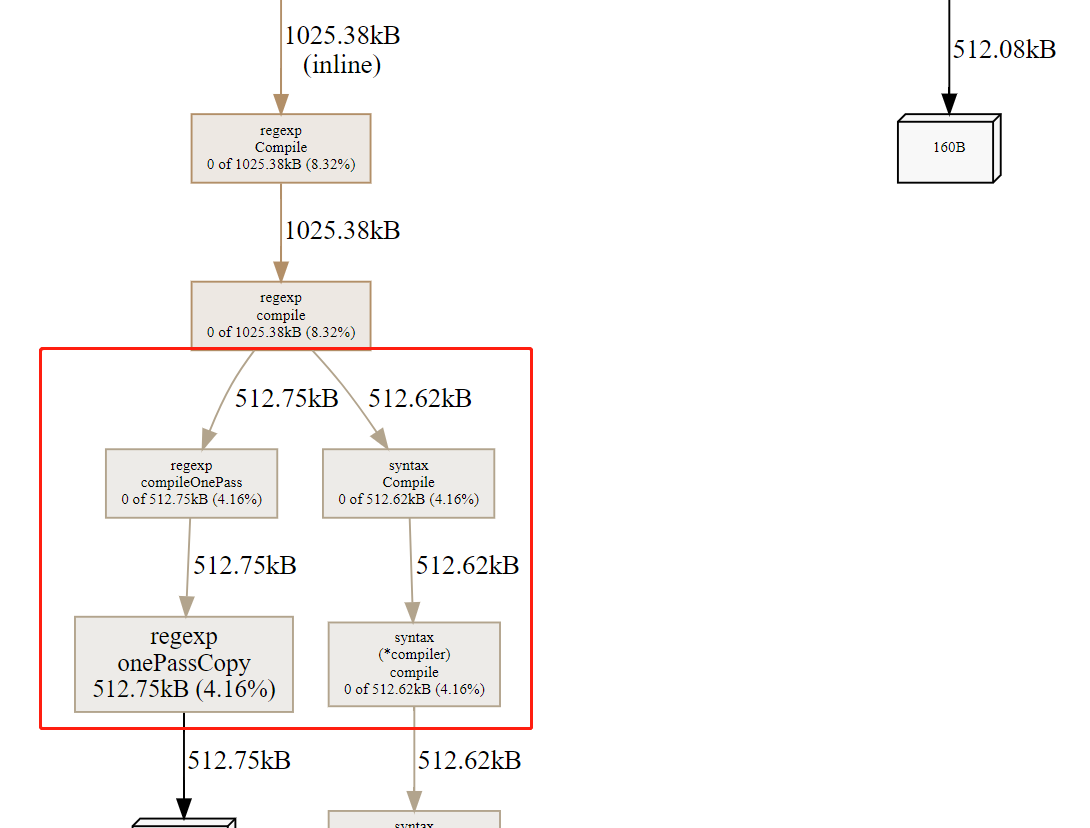
(pprof) svg
Generating report in profile002.svg
同样的,再生成调用流程图:
单机工具型
runtime/pprof 包,常用的方法如下:
StartCPUProfile:开始监控 cpuStopCPUProfile:停止监控 cpu,使用 StartCPUProfile 后一定要调用该函数停止监控WriteHeapProfile:把堆中的内存分配信息写入分析文件中
样例代码如下
import (
    "flag"
    "runtime/pprof"
    "log"
    "runtime"
    "math/rand"
    "os"
    "time"
)

var cpuprofile = flag.String("cpuprofile", "","write cpu profile `file`")
var memprofile = flag.String("memprofile", "","write memory profile to `file`")

const (
    col = 10000
    row = 10000
)

func main() {
    flag.Parse()
    if *cpuprofile != "" {
        f, err := os.Create(*cpuprofile)
        if err != nil {
            log.Fatal("could not create CPU profile:", err)
        }
        if err := pprof.StartCPUProfile(f); err != nil {  // 监控 cpu
            log.Fatal("could not start CPU profile:", err)
        }
        defer pprof.StopCPUProfile()
    }

    // 主逻辑区,进行一些简单的代码运算
    x := [row][col]int{}
    s := rand.New(rand.NewSource(time.Now().UnixNano()))

    for i := 0; i < row; i++{
        for j := 0; j < col; j++ {
            x[i][j] = s.Intn(100000)
        }
    }


    for i := 0; i < row; i++{
        tmp := 0
        for j := 0; j < col; j++ {
            tmp += x[i][j]
        }
    }


    if *memprofile != "" {
        f, err := os.Create(*memprofile)
        if err != nil {
            log.Fatal("could not create memory profile:", err)
        }
        runtime.GC() // GC,获取最新的数据信息
        if err := pprof.WriteHeapProfile(f); err != nil {  // 写入内存信息
            log.Fatal("could not write memory profile:", err)
        }
        f.Close()
    }
}
0x02 优化经验
- 熟练使用性能查看工具
pprof/trace - 对压测工具(如
wrk/ab等)要比较了解 - 代码逻辑层面的走读非常重要,要尽量避免无效逻辑
- 对于 golang 自身库存在缺陷的,可以寻找第三方库或自己改造
- golang 版本尽量更新,新版本的性能应该有所提升性能
- 本地 benchmark 结果不等于线上运行结果。尤其是在使用缓存来提高处理速度时,要考虑 GC 的影响
- 传参数或返回值时,尽量按 golang 的设计哲学,少用指针,多用值对象,避免引起过多的变量逃逸,导致 GC 耗时暴涨。struct 的大小一般在
2K以下的拷贝传值,比使用指针要快(可针对不同的机器压测,判断各自的阈值) - 值类型在满足需要的情况下,越小越好。能用
int8,就不要用int64 - 资源尽量复用,如要考虑使用
sync.Pool缓存会重复申请的内存或对象。或者自己使用并管理大块内存,用来存储小对象,避免 GC 影响
Mysql
- 查询的时候尽量考虑最小化字段,减少不必要的字段带来的传输
Redis
- 少用性能差的命令,如
Smembers等
golang库
- 在高并发场景下,一些系统调用可能会影响服务响应速度,如获取本地Ip等,可以优化为初始化后缓存,不要每次请求都获取一次,见Case1
0x02 具体 Case1
从pprof的CPU采样图发现如下图的耗时情况,排查到原因是客户端组包时使用系统调用获取上报机器的本地ip(每次请求都调用一次),结果在高并发压测时大量系统调用呆滞负载上升,影响性能。

0x03 具体 Case2:使用pprof优化内存使用
个人认为该例子还是比较典型的,通过pprof来优化程序逻辑,场景是Redis,源实例的key情况,主要是string类型和hash类型,而且hash类型存在大key(一个hash有2800w的member),所以这里怀疑是先从RDB读了一部分string,然后读到大key的时候内存突增:
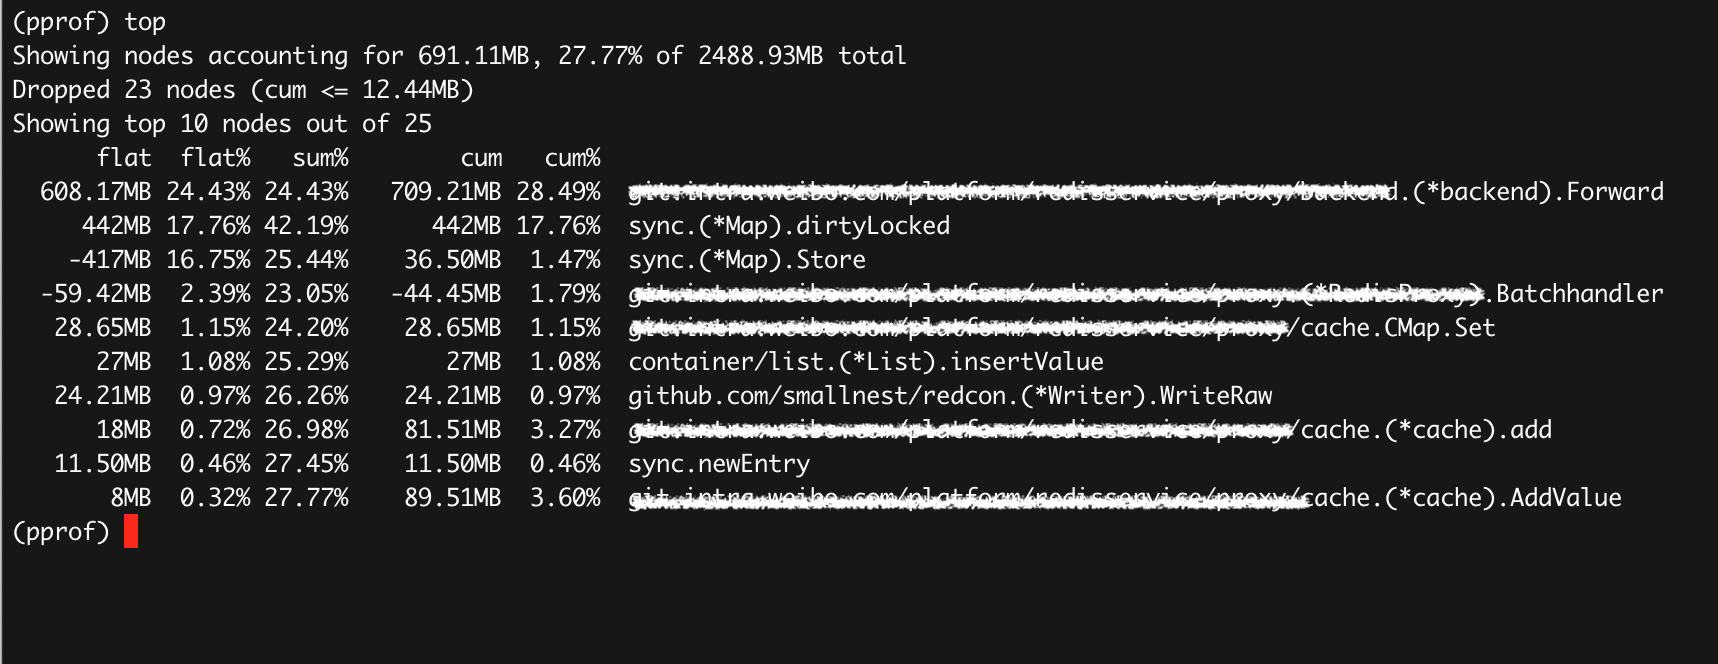
1、pprof 输出如下
(pprof) top
Showing nodes accounting for 3.73GB, 99.78% of 3.74GB total
Dropped 5 nodes (cum <= 0.02GB)
Showing top 10 nodes out of 16
      flat  flat%   sum%        cum   cum%
    3.70GB 98.94% 98.94%     3.70GB 98.94%  bytes.makeSlice /usr/local/go/src/bytes/buffer.go
    0.03GB  0.83% 99.78%     0.03GB  0.83%  main.(*cmdRestore).Main /usr/local/go/src/bufio/bufio.go
         0     0% 99.78%     3.70GB 98.94%  bytes.(*Buffer).Write /usr/local/go/src/bytes/buffer.go
         0     0% 99.78%     3.70GB 98.94%  bytes.(*Buffer).grow /usr/local/go/src/bytes/buffer.go
         0     0% 99.78%     3.70GB 98.94%  github.com/CodisLabs/redis-port/pkg/rdb.(*Loader).NextBinEntry go_workspace/src/github.com/CodisLabs/redis-port/pkg/rdb/loader.go
         0     0% 99.78%     3.70GB 98.94%  github.com/CodisLabs/redis-port/pkg/rdb.(*rdbReader).Read go_workspace/src/github.com/CodisLabs/redis-port/pkg/rdb/reader.go
         0     0% 99.78%     3.70GB 98.94%  github.com/CodisLabs/redis-port/pkg/rdb.(*rdbReader).ReadBytes go_workspace/src/github.com/CodisLabs/redis-port/pkg/rdb/reader.go
         0     0% 99.78%     3.70GB 98.94%  github.com/CodisLabs/redis-port/pkg/rdb.(*rdbReader).ReadString go_workspace/src/github.com/CodisLabs/redis-port/pkg/rdb/reader.go
         0     0% 99.78%     3.70GB 98.94%  github.com/CodisLabs/redis-port/pkg/rdb.(*rdbReader).readFull go_workspace/src/github.com/CodisLabs/redis-port/pkg/rdb/reader.go
         0     0% 99.78%     3.70GB 98.94%  github.com/CodisLabs/redis-port/pkg/rdb.(*rdbReader).readObjectValue go_workspace/src/github.com/CodisLabs/redis-port/pkg/rdb/reader.go
2、可以看到大部分内存都是 bytes.makeSlice 产生的(flat 98.94%),不过这是一个标准库函数,再撸撸代码,往下看可以看到 redis-port 实现的函数 (*Loader).NextBinEntry,使用 list 命令查看
(pprof) list NextBinEntry
Total: 3.74GB
ROUTINE ======================== github.com/CodisLabs/redis-port/pkg/rdb.(*Loader).NextBinEntry in go_workspace/src/github.com/CodisLabs/redis-port/pkg/rdb/loader.go
         0     3.70GB (flat, cum) 98.94% of Total
         .          .    137:           default:
         .          .    138:                   key, err := l.ReadString()
         .          .    139:                   if err != nil {
         .          .    140:                           return nil, err
         .          .    141:                   }
         .     3.70GB    142:                   val, err := l.readObjectValue(t)
         .          .    143:                   if err != nil {
         .          .    144:                           return nil, err
         .          .    145:                   }
         .          .    146:                   entry.DB = l.db
         .          .    147:                   entry.Key = key
3、前后调用关系的调用栈图
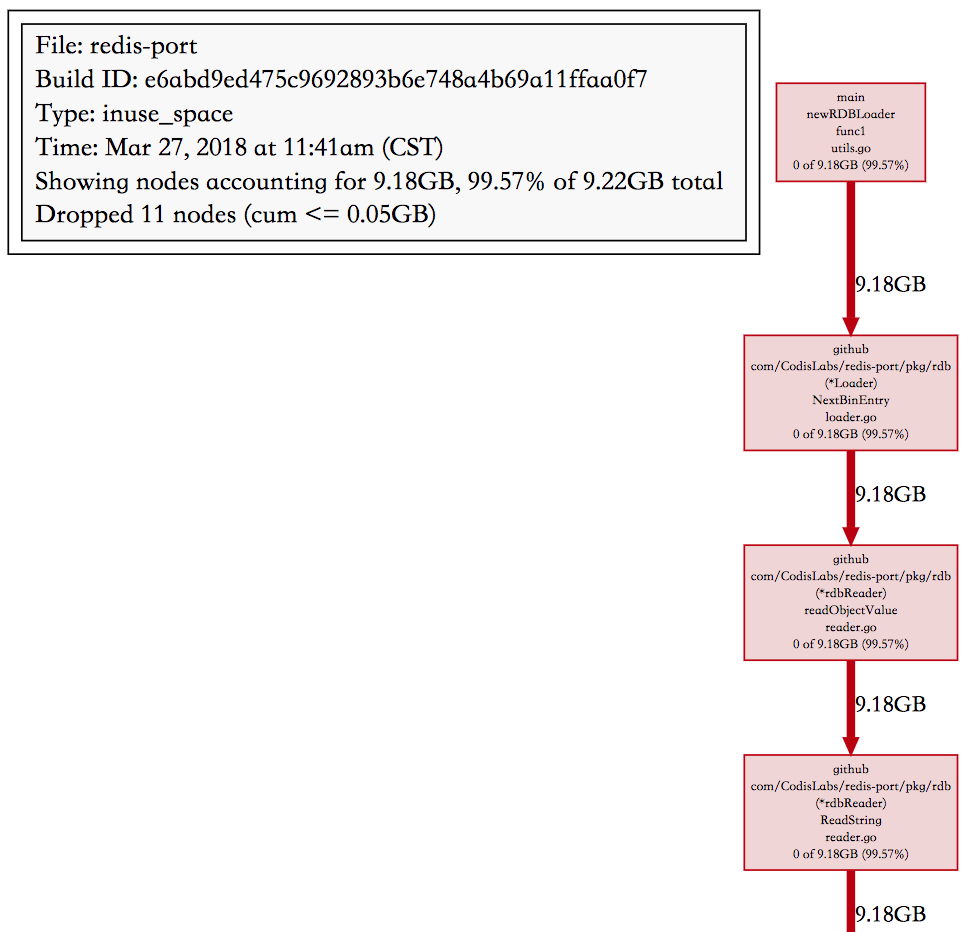
4、定位问题及解决
redis-port 在解析 RDB 时,是按 key 为粒度来处理的,遇到大 key 时,value 可能有好几个 GB,然后 redis-port 直接使用了标准库 bytes.Buffer 来存储解析出来的 value,Buffer 在空间不够的时候会自己 grow,策略是当前 capacity 2 倍的增长速度(避免频繁内存分配)。Buffer 在空间不够时,申请一个当前空间 2 倍的 byte 数组,然后把老的 copy 到这里,这个峰值内存就是 3 倍的开销,如果 value 大小 5GB,读到 4GB 空间不够,那么创建一个 8GB 的新 buffer,那么峰值就是 12GB 了,此外 Buffer 的初始大小是 64 字节,在增长到 4GB 的过程中也会创建很多的临时 []byte,gc 不及时也是额外的内存开销,所以 4.5GB 的 RDB,在有大 key 的情况下,峰值内存用到 15GB 也就可以理解了。
// grow grows the buffer to guarantee space for n more bytes.
// It returns the index where bytes should be written.
// If the buffer can't grow it will panic with ErrTooLarge.
func (b *Buffer) grow(n int) int {
//......
    } else {
        // Not enough space anywhere, we need to allocate.
        buf := makeSlice(2*cap(b.buf) + n)
        copy(buf, b.buf[b.off:])
        b.buf = buf
    }
//......
}
这个问题的根本原因还是按 key 处理一次读的 value 太大,在碰到 hash 这种复杂数据类型时,其实我们可以分而治之,读了一部分 value 后,比如 16MB 就生成一个子 hash,避免 Buffer grow 产生太大的临时对象