0x00 前言
proc文件系统(procfs)是一种基于内核的VFS,以文件系统目录和文件形式,提供一个指向内核数据结构的接口,通过它能够查看和改变各种系统属性。从开发者角度说,Procfs 是一种特殊的虚拟文件系统,可以挂载到用户的目录树中,允许用户空间中的进程使用系统调用(如write/read等)方便地读取内核信息
本文内核代码基于 v4.11.6 版本
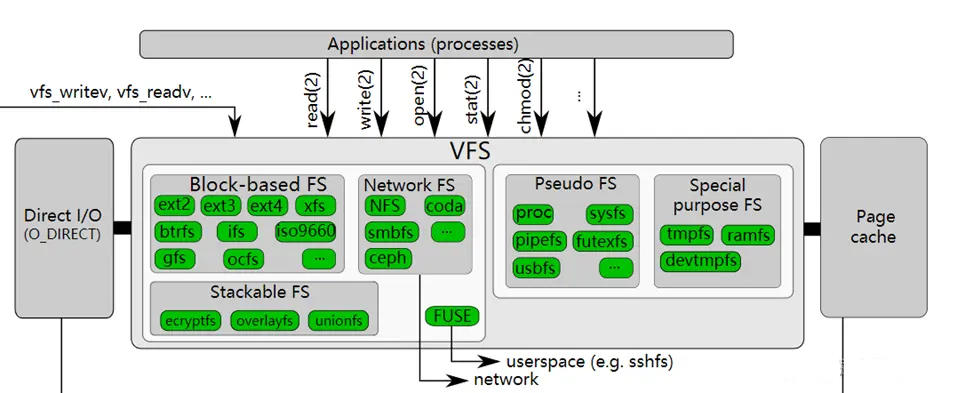
- procfs 它不依赖物理存储设备,而是由内核动态生成文件和目录,用于暴露系统信息(如进程状态、硬件配置、内核参数等),它通过注册到 VFS 的机制,将自己挂载到文件系统树(
/proc),并遵循 VFS 的接口规范(如inode_operations、file_operations) - 内核数据结构:procfs 的内容(如
/proc/cpuinfo、/proc/meminfo等)由内核动态生成,通过回调函数响应读/写操作 - VFS 接口:procfs 需要实现 VFS 定义的操作函数(例如
open()、read()、readdir()),才能被用户空间访问 - procfs 的功能和内容完全由内核管理,通过
mount -t proc proc /proc命令将 procfs 挂载到 VFS 树中,使其成为文件系统的一部分
挂载proc
# Mount the `proc` device under `/proc`
# with the filesystem type specified as
# `proc`.
#
# note.: you could mount procfs pretty much
#        anywhere you want and specify any
#        device name.
#
#
#         .------------> fs type
#         |
#         |     .------> device (dummy identifier
#         |    |         in this case - anything)
#         |    |
#         |    |     .-> location
#         |    |     |
#         |    |     |
mount -t proc proc /proc
0x01 引言:访问/proc文件
/proc/目录下包含了文件和目录(pid维度)
[root@VM-X-X-tencentos ~]# ls /proc/ -al
total 4
dr-xr-xr-x 270 root  root               0 Nov  7 07:06 .
dr-xr-xr-x  19 root  root            4096 Nov  7 16:46 ..
dr-xr-xr-x   8 root  root               0 Nov  7 07:06 1
......
dr-xr-xr-x   8 root  root               0 Nov  7 07:06 15
dr-xr-xr-x   8 root  root               0 Nov  7 07:07 996
dr-xr-xr-x   3 root  root               0 Nov  7 07:06 acpi
-r--r--r--   1 root  root               0 Nov  7 07:07 bt_stat
-r--r--r--   1 root  root               0 Nov  7 16:45 buddyinfo
dr-xr-xr-x   4 root  root               0 Nov  7 07:07 bus
-r--r--r--   1 root  root               0 Nov  7 07:06 cgroups
-r--r--r--   1 root  root               0 Nov  7 07:06 cmdline
-r--r--r--   1 root  root           30094 Nov  7 07:07 config.gz
-r--r--r--   1 root  root               0 Nov  7 16:45 consoles
-r--r--r--   1 root  root               0 Nov  7 07:06 cpuinfo
-r--r--r--   1 root  root               0 Nov  7 16:45 crypto
-r--r--r--   1 root  root               0 Nov  7 16:45 devices
-r--r--r--   1 root  root               0 Nov  7 07:07 diskstats
-r--r--r--   1 root  root               0 Nov  7 16:45 dma
dr-xr-xr-x   4 root  root               0 Nov  7 16:45 driver
-r--r--r--   1 root  root               0 Nov  7 16:45 execdomains
-r--r--r--   1 root  root               0 Nov  7 16:45 fb
-r--r--r--   1 root  root               0 Nov  7 07:06 filesystems
dr-xr-xr-x   5 root  root               0 Nov  7 07:07 fs
-r--r--r--   1 root  root               0 Nov  7 07:06 interrupts
-r--r--r--   1 root  root               0 Nov  7 07:07 iomem
-r--r--r--   1 root  root               0 Nov  7 16:45 ioports
dr-xr-xr-x  28 root  root               0 Nov  7 07:06 irq
-r--r--r--   1 root  root               0 Nov  7 07:07 kallsyms
-r--------   1 root  root 140737477890048 Nov  7 07:06 kcore
-r--r--r--   1 root  root               0 Nov  7 16:45 keys
-r--r--r--   1 root  root               0 Nov  7 16:45 key-users
-r--------   1 root  root               0 Nov  7 16:45 kmsg
-r--------   1 root  root               0 Nov  7 16:45 kpagecgroup
-r--------   1 root  root               0 Nov  7 16:45 kpagecount
-r--------   1 root  root               0 Nov  7 16:45 kpageflags
-rw-r--r--   1 root  root               0 Nov  7 16:45 latency_stats
-r--r--r--   1 root  root               0 Nov  7 07:07 loadavg
-r--r--r--   1 root  root               0 Nov  7 16:45 loadavg_bt
-r--r--r--   1 root  root               0 Nov  7 16:45 locks
-r--r--r--   1 root  root               0 Nov  7 07:17 mdstat
dr-xr-xr-x   2 root  root               0 Nov  7 16:45 megaraid
-r--r--r--   1 root  root               0 Nov  7 07:06 meminfo
-r--r--r--   1 root  root               0 Nov  7 16:45 misc
-r--r--r--   1 root  root               0 Nov  7 16:45 module_md5_list
-r--r--r--   1 root  root               0 Nov  7 07:07 modules
lrwxrwxrwx   1 root  root              11 Nov  7 07:06 mounts -> self/mounts
dr-xr-xr-x   4 root  root               0 Nov  7 16:45 mpt
-rw-r--r--   1 root  root               0 Nov  7 16:45 mtrr
lrwxrwxrwx   1 root  root               8 Nov  7 07:06 net -> self/net
-r--------   1 root  root               0 Nov  7 16:45 pagetypeinfo
-r--r--r--   1 root  root               0 Nov  7 07:06 partitions
dr-xr-xr-x   5 root  root               0 Nov  7 07:07 pressure
dr-xr-xr-x   3 root  root               0 Nov  7 16:45 rue
-r--r--r--   1 root  root               0 Nov  7 16:45 sched_debug
-r--r--r--   1 root  root               0 Nov  7 16:45 schedstat
dr-xr-xr-x   5 root  root               0 Nov  7 16:45 scsi
lrwxrwxrwx   1 root  root               0 Nov  7 07:06 self -> 26694
-r--------   1 root  root               0 Nov  7 16:45 slabinfo
dr-xr-xr-x   5 root  root               0 Nov  7 16:45 sli
-r--r--r--   1 root  root               0 Nov  7 16:45 softirqs
-r--r--r--   1 root  root               0 Nov  7 07:07 stat
-r--r--r--   1 root  root               0 Nov  7 07:06 swaps
dr-xr-xr-x   1 root  root               0 Nov  7 07:06 sys
--w-------   1 root  root               0 Nov  7 16:45 sysrq-trigger
dr-xr-xr-x   5 root  root               0 Nov  7 16:45 sysvipc
lrwxrwxrwx   1 root  root               0 Nov  7 07:06 thread-self -> 26694/task/26694
-r--------   1 root  root               0 Nov  7 16:45 timer_list
dr-xr-xr-x   5 root  root               0 Nov  7 16:45 tkernel
dr-xr-xr-x   6 root  root               0 Nov  7 07:07 tty
-r--r--r--   1 root  root               0 Nov  7 07:06 uptime
-r--r--r--   1 root  root               0 Nov  7 07:07 version
-r--------   1 root  root               0 Nov  7 16:45 vmallocinfo
-r--r--r--   1 root  root               0 Nov  7 07:07 vmstat
-r--r--r--   1 root  root               0 Nov  7 16:45 zoneinfo
比如,访问进程13323下的limits文件,能获取到本进程的资源限制
[root@VM-X-X-tencentos bcc]#  cat /proc/13323/limits
Limit                     Soft Limit           Hard Limit           Units
Max cpu time              unlimited            unlimited            seconds
Max file size             unlimited            unlimited            bytes
Max data size             unlimited            unlimited            bytes
Max stack size            8388608              unlimited            bytes
Max core file size        0                    0                    bytes
Max resident set          unlimited            unlimited            bytes
Max processes             62825                62825                processes
Max open files            1024                 524288               files
Max locked memory         8388608              8388608              bytes
Max address space         unlimited            unlimited            bytes
Max file locks            unlimited            unlimited            locks
Max pending signals       62825                62825                signals
Max msgqueue size         819200               819200               bytes
Max nice priority         0                    0
Max realtime priority     0                    0
Max realtime timeout      unlimited            unlimited            us
使用bcc的trace工具跟踪上面的cat过程,可以看到最终调用了proc_pid_limits函数
PID     TID     COMM            FUNC
21450   21450   cat             proc_pid_limits
        proc_pid_limits+0x1
        seq_read+0xe5
        __vfs_read+0x1b
        vfs_read+0x8e       #调用链vfs_read
        sys_read+0x55
        do_syscall_64+0x73
        entry_SYSCALL_64_after_hwframe+0x3d

再列举一个例子,访问ls /proc/13323/fd可以知道当前进程13323打开了哪些fd:
[root@VM-X-X-tencentos proc]# ll -ath /proc/13323/fd
total 0
lrwx------ 1 root root 64 Feb 10 10:43 1 -> /dev/pts/1
lrwx------ 1 root root 64 Feb 10 10:43 2 -> /dev/pts/1
lr-x------ 1 root root 64 Feb 10 10:43 3 -> 'pipe:[2640532256]'
lrwx------ 1 root root 64 Feb 10 10:43 4 -> 'socket:[2640532254]'
l-wx------ 1 root root 64 Feb 10 10:43 5 -> 'pipe:[2640532256]'
lr-x------ 1 root root 64 Feb 10 10:43 6 -> /etc/sudoers
lrwx------ 1 root root 64 Feb 10 10:43 7 -> 'socket:[2640532270]'
dr-x------ 2 root root  8 Feb 10 10:43 .
lrwx------ 1 root root 64 Feb 10 10:43 0 -> /dev/pts/1
dr-xr-xr-x 9 root root  0 Feb 10 10:43 ..
上面的命令对应用户态内核态切换如下图:

procs 详情
/proc下面主要包含如下内容:
- 静态生成的(系统初始化生成),比如
/proc/fs、/proc/fb、/proc/net等,这部分子目录在系统初始化时候,应该挂载在proc目录对应的proc_dir_entry链表下 .、..子目录,分别是对当前目录和父目录的链接/proc/下由数字组成的进程子目录是每次读取proc内容动态生成,即动态遍历当前进程列表形成;以及每进程子目录下子目录/子文件的形成
proc下的主要目录&&文件
参考:Linux Procfs (一) /proc/* 文件实例解析
seq_file机制
TODO
在procfs的内核实现中,大量出现了seq_*相关实现,seq_read在普通的文件read中加入了内核缓冲的功能,从而实现顺序多次遍历,读取大数据量的简单接口
游标机制的详细介绍
0x02 procfs 的内核视角
pseudo FS的实现本质
在传统的磁盘文件系统(如 ext4)中,文件代表的是一段存储在物理介质上的静态数据(对应于inode),在 procfs 中,文件只是一个内核窗口(如/proc/cpuinfo并不是一个真正的磁盘文件),即触发读取时,内核会捕获到 read 系统调用,并立即触发了与该文件绑定的回调函数,实时搜集当前的硬件信息并格式化成文本返回。
每个 /proc 节点都可以定义自己的 struct file_operations,在procfs中,常用的成员如下:
.read: 对应用户态的read(),定义如何生成数据。.write: 对应用户态的write(),允许用户通过向文件写入字符串来修改内核参数(如echo 1 > /proc/sys/net/ipv4/ip_forward).open: 定义打开文件时的初始化操作- 对于比较复杂、需要输出大量结构化数据的文件(如
/proc/net/dev等),内核通常会使用seq_file接口,常用于处理大数据量的分页读取
核心数据结构
proc_dir_entry:对/proc目录的描述pid_entry:proc目录下面的进程子目录,是对应与每一个进程ID pid目录的描述
proc_inode:类比于VFS的inode
struct proc_inode 这个结构的意义是 procfs 幻象映射到实体,类比与VFS架构中的inode概念(有一个vfs_inode成员),进一步说,proc_inode 是内核 VFS 层的 struct inode 在 procfs 的扩展
proc_inode本质上是一个带状态的容器,VFS 只管调用 read/write函数,它并不关心文件背后的逻辑,但当 VFS 拿着 vfs_inode 找到 procfs 驱动时,内核利用 container_of 宏通过 vfs_inode 的地址反推回整个 proc_inode 的首地址,这样就可以知道它的类型是 pde 或pid。如果是 pde,就去执行 pde->proc_fops 里的回调函数,如果是 pid类型,就去遍历 task_struct
//proc_inode列出的这些成员,揭示了 /proc 下不同文件的分类处理逻辑
struct proc_inode {
	struct pid *pid;	//如果这个 inode 代表的是一个进程目录(如 /proc/123),这个指针就指向该进程的 PID 描述符
	unsigned int fd;
	union proc_op op;	//联合体,存储了该 inode 对应的具体操作函数集(比如是处理 fd 的,还是处理空间的)
	struct proc_dir_entry *pde;	//如果是静态注册的文件(如 /proc/meminfo),这个指针就指向它的身份证
	struct ctl_table_header *sysctl;	//sysctl相关:专门用于 /proc/sys 下的内核参数修改逻辑
	struct ctl_table *sysctl_entry;
	struct list_head sysctl_inodes;
	const struct proc_ns_operations *ns_ops;
	struct inode vfs_inode;
};
内核初始化时,procfs 文件系统会注册一个专用的内存池,当访问 /proc 下的某个文件时,内核会从此内存池中创建proc_inode节点,参考proc_alloc_inode实现,这里有个小细节(结构体嵌入),由于 vfs_inode 是 proc_inode 结构体的最后一个成员,内核实际上分配的是整个proc_inode 的大小,但返回给 VFS 层的是其中 vfs_inode 的地址,如此通过内核的container_of宏,就可以获取其他成员的地址了。当文件不再被使用(引用计数归零)且 VFS 决定回收其缓存时,内核会调用 proc_destroy_inode,将其占用的内存归还给 SLAB 内存池
简单介绍下内核(按需)分配proc_inode的场景:
1、case1:路径查找,如ls /proc/meminfo 或 cat /proc/[pid]/status 时,VFS 需要根据路径名找到对应的 inode,不存在时的处理:
- VFS 发现内存中没有这个文件的 inode 缓存(dentry cache miss)
- VFS 调用
/proc目录定义的lookup回调函数 - 内核根据这个文件的对应的类型(如
proc_dir_entry或task_struct),实时创建一个proc_inode
2、case2:进程目录访问,当访问 /proc/[pid] 相关的目录时,内核会根据当前的 pid 结构体动态实例化一个 proc_inode,并将 struct pid 指针存入给出的那个 pid 成员中
现在从代码上分析下上述的过程,从根目录proc_root_lookup出发
static struct dentry *proc_root_lookup(struct inode * dir, struct dentry * dentry, unsigned int flags)
{
	//case2
	if (!proc_pid_lookup(dir, dentry, flags))
		return NULL;

	//case1
	return proc_lookup(dir, dentry, flags);
}

struct dentry *proc_lookup(struct inode *dir, struct dentry *dentry,
		unsigned int flags)
{
	return proc_lookup_de(PDE(dir), dir, dentry);
}

struct dentry *proc_lookup_de(struct proc_dir_entry *de, struct inode *dir,
		struct dentry *dentry)
{
	struct inode *inode;

	read_lock(&proc_subdir_lock);
	de = pde_subdir_find(de, dentry->d_name.name, dentry->d_name.len);
	// 如果查询命中了
	if (de) {
		pde_get(de);
		read_unlock(&proc_subdir_lock);
		// 获取inode信息
		inode = proc_get_inode(dir->i_sb, de);
		if (!inode)
			return ERR_PTR(-ENOMEM);
		d_set_d_op(dentry, &simple_dentry_operations);
		d_add(dentry, inode);
		return NULL;
	}
	read_unlock(&proc_subdir_lock);
	return ERR_PTR(-ENOENT);
}

//https://elixir.bootlin.com/linux/v4.11.6/source/fs/proc/inode.c#L432
struct inode *proc_get_inode(struct super_block *sb, struct proc_dir_entry *de)
{
	// 分配一个inode(在procs中实际上的proc_inode)
	struct inode *inode = new_inode_pseudo(sb);

	if (inode) {
		inode->i_ino = de->low_ino;
		inode->i_mtime = inode->i_atime = inode->i_ctime = current_time(inode);
		PROC_I(inode)->pde = de;

		if (is_empty_pde(de)) {
			make_empty_dir_inode(inode);
			return inode;
		}
		if (de->mode) {
			inode->i_mode = de->mode;
			inode->i_uid = de->uid;
			inode->i_gid = de->gid;
		}
		if (de->size)
			inode->i_size = de->size;
		if (de->nlink)
			set_nlink(inode, de->nlink);
		WARN_ON(!de->proc_iops);
		inode->i_op = de->proc_iops;
		if (de->proc_fops) {
			if (S_ISREG(inode->i_mode)) {
					inode->i_fop = &proc_reg_file_ops;
			} else {
				inode->i_fop = de->proc_fops;
			}
		}
	} else
	       pde_put(de);
	return inode;
}

//https://elixir.bootlin.com/linux/v4.11.6/source/fs/inode.c#L887
struct inode *new_inode_pseudo(struct super_block *sb)
{
	struct inode *inode = alloc_inode(sb);

	if (inode) {
		spin_lock(&inode->i_lock);
		inode->i_state = 0;
		spin_unlock(&inode->i_lock);
		INIT_LIST_HEAD(&inode->i_sb_list);
	}
	return inode;
}

//https://elixir.bootlin.com/linux/v4.11.6/source/fs/inode.c#L202
static struct inode *alloc_inode(struct super_block *sb)
{
	struct inode *inode;

	//如果super_block定义了alloc_inode的实现
	if (sb->s_op->alloc_inode)
		inode = sb->s_op->alloc_inode(sb);
	else
		inode = kmem_cache_alloc(inode_cachep, GFP_KERNEL);

	......

	return inode;
}
最后看下,上面sb->s_op->alloc_inode定义在struct super_block结构中的回调函数alloc_inode是什么
//https://elixir.bootlin.com/linux/v4.11.6/source/fs/proc/inode.c
static const struct super_operations proc_sops = {
	.alloc_inode	= proc_alloc_inode,	//proc对应的super_block下的回调定义
	.destroy_inode	= proc_destroy_inode,
	.drop_inode	= generic_delete_inode,
	......
};
proc_dir_entry
proc_dir_entry的结构如下:
struct proc_dir_entry {
	unsigned int low_ino;
	umode_t mode;
	nlink_t nlink;
	kuid_t uid;
	kgid_t gid;
	loff_t size;
	const struct inode_operations *proc_iops;     // 文件inode操作函数
	const struct file_operations *proc_fops;     // 文件操作函数
	struct proc_dir_entry *parent;
	struct rb_root subdir;
	struct rb_node subdir_node;
	void *data;
	atomic_t count;		/* use count */
	atomic_t in_use;	/* number of callers into module in progress; */
			/* negative -> it's going away RSN */
	struct completion *pde_unload_completion;
	struct list_head pde_openers;	/* who did ->open, but not ->release */
	spinlock_t pde_unload_lock; /* proc_fops checks and pde_users bumps */
	u8 namelen;
	char name[];
};
注意,在高版本的内核中,subdir、subdir_node已经调整为红黑树的实现了,2.6的内核实现是链表。数据结构proc_dir_entry在内核中代表了一个proc入口,在procfs中表现为一个文件,可以在这个结构体中看到一些文件特有的属性成员,如uid、gid、mode、name等
proc_dir_entry的本质是什么?因为本身procfs就是一个伪文件系统,不像ext4这种有文件实体(inode)可以使用,内核需要一种方式在内存里持久化地维护目录结构,所以proc_dir_entry 本质上是一个内存驻留的结构体,代表了 /proc 树中的一个节点。当调用 proc_create()/proc_mkdir() 时,内核就在内存中实例化了一个 PDE,可以理解proc_dir_entry与struct file结构体的功能有点类似。此外,PDE 与 Inode 的关系如下:
- PDE:持久的,只要内核没卸载,
meminfo的 PDE 就一直存在于内存中 - Inode:临时节点,如当打开
meminfo时,内核才会根据 PDE 里的信息,临时在内存里幻化出一个 inode 对象供 VFS 使用。一旦文件关闭且不再被缓存,这个 inode 就会被销毁,但 PDE 依然常驻
PDE 核心成员如下:
name:文件(路径)名(如meminfo)mode:文件权限(如S_IRUGO)proc_fops: 指向file_operations的指针data:一个私有指针void *data
下面成员维护了整个 /proc 的层级关系:
parent: 指向父目录的指针subdir: 指向第一个子节点的指针next: 指向同级兄弟节点的指针
/proc/下文件(目录)的两种生成策略:
- 如
ls /proc/sys/vm/*,内核就是通过遍历 PDE 形成的这棵兄弟链表树来找到目标节点的,此类节点是内核模块在加载时显式注册到这棵 PDE 树上的 - 如
ls /proc/下面的pid目录,PID 目录是动态扫描task_struct产生的(动态计算)
pid_entry
struct pid_entry {
	const char *name;
	unsigned int len;
	umode_t mode;
	const struct inode_operations *iop;
	const struct file_operations *fop;
	union proc_op op;
};
pid_entry下面所有的文件的操作方法都定义在tgid_base_stuff结构中
static const struct pid_entry tgid_base_stuff[] = {
	DIR("task",       S_IRUGO|S_IXUGO, proc_task_inode_operations, proc_task_operations),
	DIR("fd",         S_IRUSR|S_IXUSR, proc_fd_inode_operations, proc_fd_operations),
	DIR("map_files",  S_IRUSR|S_IXUSR, proc_map_files_inode_operations, proc_map_files_operations),
	DIR("fdinfo",     S_IRUSR|S_IXUSR, proc_fdinfo_inode_operations, proc_fdinfo_operations),
	DIR("ns",	  S_IRUSR|S_IXUGO, proc_ns_dir_inode_operations, proc_ns_dir_operations),
#ifdef CONFIG_NET
	DIR("net",        S_IRUGO|S_IXUGO, proc_net_inode_operations, proc_net_operations),
#endif
	REG("environ",    S_IRUSR, proc_environ_operations),
	REG("auxv",       S_IRUSR, proc_auxv_operations),
	ONE("status",     S_IRUGO, proc_pid_status),
	ONE("personality", S_IRUSR, proc_pid_personality),
	ONE("limits",	  S_IRUGO, proc_pid_limits),
#ifdef CONFIG_SCHED_DEBUG
	REG("sched",      S_IRUGO|S_IWUSR, proc_pid_sched_operations),
#endif
#ifdef CONFIG_SCHED_AUTOGROUP
	REG("autogroup",  S_IRUGO|S_IWUSR, proc_pid_sched_autogroup_operations),
#endif
	REG("comm",      S_IRUGO|S_IWUSR, proc_pid_set_comm_operations),
#ifdef CONFIG_HAVE_ARCH_TRACEHOOK
	ONE("syscall",    S_IRUSR, proc_pid_syscall),
#endif
	REG("cmdline",    S_IRUGO, proc_pid_cmdline_ops),
	ONE("stat",       S_IRUGO, proc_tgid_stat),
	ONE("statm",      S_IRUGO, proc_pid_statm),
	REG("maps",       S_IRUGO, proc_pid_maps_operations),
#ifdef CONFIG_NUMA
	REG("numa_maps",  S_IRUGO, proc_pid_numa_maps_operations),
#endif
	REG("mem",        S_IRUSR|S_IWUSR, proc_mem_operations),
	LNK("cwd",        proc_cwd_link),
	LNK("root",       proc_root_link),
	LNK("exe",        proc_exe_link),
	REG("mounts",     S_IRUGO, proc_mounts_operations),
	REG("mountinfo",  S_IRUGO, proc_mountinfo_operations),
	REG("mountstats", S_IRUSR, proc_mountstats_operations),
#ifdef CONFIG_PROC_PAGE_MONITOR
	REG("clear_refs", S_IWUSR, proc_clear_refs_operations),
	REG("smaps",      S_IRUGO, proc_pid_smaps_operations),
	REG("pagemap",    S_IRUSR, proc_pagemap_operations),
#endif
#ifdef CONFIG_SECURITY
	DIR("attr",       S_IRUGO|S_IXUGO, proc_attr_dir_inode_operations, proc_attr_dir_operations),
#endif
#ifdef CONFIG_KALLSYMS
	ONE("wchan",      S_IRUGO, proc_pid_wchan),
#endif
#ifdef CONFIG_STACKTRACE
	ONE("stack",      S_IRUSR, proc_pid_stack),
#endif
#ifdef CONFIG_SCHED_INFO
	ONE("schedstat",  S_IRUGO, proc_pid_schedstat),
#endif
#ifdef CONFIG_LATENCYTOP
	REG("latency",  S_IRUGO, proc_lstats_operations),
#endif
#ifdef CONFIG_PROC_PID_CPUSET
	ONE("cpuset",     S_IRUGO, proc_cpuset_show),
#endif
#ifdef CONFIG_CGROUPS
	ONE("cgroup",  S_IRUGO, proc_cgroup_show),
#endif
	ONE("oom_score",  S_IRUGO, proc_oom_score),
	REG("oom_adj",    S_IRUGO|S_IWUSR, proc_oom_adj_operations),
	REG("oom_score_adj", S_IRUGO|S_IWUSR, proc_oom_score_adj_operations),
#ifdef CONFIG_AUDITSYSCALL
	REG("loginuid",   S_IWUSR|S_IRUGO, proc_loginuid_operations),
	REG("sessionid",  S_IRUGO, proc_sessionid_operations),
#endif
#ifdef CONFIG_FAULT_INJECTION
	REG("make-it-fail", S_IRUGO|S_IWUSR, proc_fault_inject_operations),
#endif
#ifdef CONFIG_ELF_CORE
	REG("coredump_filter", S_IRUGO|S_IWUSR, proc_coredump_filter_operations),
#endif
#ifdef CONFIG_TASK_IO_ACCOUNTING
	ONE("io",	S_IRUSR, proc_tgid_io_accounting),
#endif
#ifdef CONFIG_HARDWALL
	ONE("hardwall",   S_IRUGO, proc_pid_hardwall),
#endif
#ifdef CONFIG_USER_NS
	REG("uid_map",    S_IRUGO|S_IWUSR, proc_uid_map_operations),
	REG("gid_map",    S_IRUGO|S_IWUSR, proc_gid_map_operations),
	REG("projid_map", S_IRUGO|S_IWUSR, proc_projid_map_operations),
	REG("setgroups",  S_IRUGO|S_IWUSR, proc_setgroups_operations),
#endif
#if defined(CONFIG_CHECKPOINT_RESTORE) && defined(CONFIG_POSIX_TIMERS)
	REG("timers",	  S_IRUGO, proc_timers_operations),
#endif
	REG("timerslack_ns", S_IRUGO|S_IWUGO, proc_pid_set_timerslack_ns_operations),
};
tgid_base_stuff结构中的几个宏定义:
1、DIR:目录条目,DIR("task", S_IRUGO|S_IXUGO, proc_task_inode_operations, proc_task_operations)表示创建目录/proc/<pid>/task/,该目录包含该进程的所有线程信息,参数分别表示目录名、权限、inode操作、文件操作
static const struct file_operations proc_task_operations = {
	.read		= generic_read_dir,
	.iterate_shared	= proc_task_readdir,	//proc_task_readdir:对应的目录遍历方法实现
	.llseek		= generic_file_llseek,
};

static const struct inode_operations proc_task_inode_operations = {
	.lookup		= proc_task_lookup,
	.getattr	= proc_task_getattr,
	.setattr	= proc_setattr,
	.permission	= proc_pid_permission,
};
又如DIR("fd",S_IRUSR|S_IXUSR, proc_fd_inode_operations, proc_fd_operations),该目录表示某个进程打开的所有fd列表
[root@VM-X-X-tencentos ~]# ls /proc/1081/fd
0  1  2  3  4
const struct inode_operations proc_fd_inode_operations = {
	.lookup		= proc_lookupfd,	//lookup 对应的lookup方法实现
	.permission	= proc_fd_permission,
	.setattr	= proc_setattr,
};

const struct file_operations proc_fd_operations = {
	.read		= generic_read_dir,
	.iterate_shared	= proc_readfd,
	.llseek		= generic_file_llseek,
};
2、REG:表示常规文件条目,REG("environ", S_IRUSR, proc_environ_operations),创建一个常规文件,如/proc/<pid>/environ 文件,显示进程的环境变量,参数分别为文件名、权限、文件操作结构体
//https://elixir.bootlin.com/linux/v4.11.6/source/fs/proc/base.c#L974
static const struct file_operations proc_environ_operations = {
	.open		= environ_open,
	.read		= environ_read,
	.llseek		= generic_file_llseek,
	.release	= mem_release,
};
3、ONE:单一文件条目,ONE("status", S_IRUGO, proc_pid_status),创建一个只读的常规文件,使用简化的回调函数,如/proc/<pid>/status文件是显示进程状态信息,参数分别是文件名、权限、数据生成函数指针。与 REG 的区别是ONE 使用简单的 C,而 REG 需要完整的文件操作结构体
int proc_pid_status(struct seq_file *m, struct pid_namespace *ns,
			struct pid *pid, struct task_struct *task)
{
	struct mm_struct *mm = get_task_mm(task);

	task_name(m, task);
	task_state(m, ns, pid, task);

	if (mm) {
		task_mem(m, mm);
		mmput(mm);
	}
	task_sig(m, task);
	task_cap(m, task);
	task_seccomp(m, task);
	task_cpus_allowed(m, task);
	cpuset_task_status_allowed(m, task);
	task_context_switch_counts(m, task);
	return 0;
}
4、LNK:符号链接条目,LNK("cwd", proc_cwd_link)表示创建一个符号链接,如/proc/<pid>/cwd 链接指向进程的当前工作目录,参数分别为链接名、链接目标生成函数
[root@VM-X-X-tencentos ~]# ll -alrth  /proc/1081/
......
lrwxrwxrwx   1 root root 0 Nov  7 07:07 root -> /
lrwxrwxrwx   1 root root 0 Nov  7 07:07 cwd -> /

[root@VM-X-X-tencentos ~]# ls /proc/1081/cwd/
bin  boot  data  dev  etc  home  lib  lib64  lost+found  media  mnt  opt  proc  root  run  sbin  srv  sys  tmp  usr  var
static int proc_cwd_link(struct dentry *dentry, struct path *path)
{
	struct task_struct *task = get_proc_task(d_inode(dentry));
	int result = -ENOENT;

	if (task) {
		task_lock(task);
		if (task->fs) {
			get_fs_pwd(task->fs, path); //返回task->fs指向的目录,保存在path中
			result = 0;
		}
		task_unlock(task);
		put_task_struct(task);
	}
	return result;
}

static inline void get_fs_pwd(struct fs_struct *fs, struct path *pwd)
{
	spin_lock(&fs->lock);
	*pwd = fs->pwd;
	path_get(pwd);
	spin_unlock(&fs->lock);
}
上面介绍的回调函数,如struct file_operations/inode_operations等,即当触发内核代码调用VFS架构下的struct file/inode的操作时,会调用响应的操作函数(如file_operations的open/read/llseek等),未定义的操作即不支持
小结
当程序读取/proc下面的文件时,内核的处理如下:

0x03 proc_dir_entry 主要功能分析
本小节主要基于内核代码,分析下/proc及子目录的初始化流程
1、内核初始化创建/proc目录,代码
asmlinkage void __init start_kernel(void)
{
	//...
    proc_root_init();
	//...
}
2、proc_root_init->register_filesystem->proc_sys_init
void __init proc_root_init(void)
{
	int err;

	proc_init_inodecache();
	set_proc_pid_nlink();
	err = register_filesystem(&proc_fs_type);	//  注册proc文件系统
	if (err)
		return;

	proc_self_init();
	proc_thread_self_init();
	proc_symlink("mounts", NULL, "self/mounts");	 // 创建 mounts 符号链接文件

	proc_net_init();							 // 创建 net符号链接及内部目录树结构

#ifdef CONFIG_SYSVIPC
	proc_mkdir("sysvipc", NULL);
#endif
	proc_mkdir("fs", NULL);						// 创建 fs 目录
	proc_mkdir("driver", NULL);					// 创建 drivers 目录
	proc_create_mount_point("fs/nfsd"); /* somewhere for the nfsd filesystem to be mounted */
#if defined(CONFIG_SUN_OPENPROMFS) || defined(CONFIG_SUN_OPENPROMFS_MODULE)
	/* just give it a mountpoint */
	proc_create_mount_point("openprom");
#endif
	proc_tty_init();
	proc_mkdir("bus", NULL);
	proc_sys_init();							// 创建sys目录并初始化
}

//注册proc文件系统
//https://elixir.bootlin.com/linux/v4.11.6/source/fs/proc/root.c#L116
static struct file_system_type proc_fs_type = {
	.name		= "proc",
	.mount		= proc_mount,	//挂载入口
	.kill_sb	= proc_kill_sb,
	.fs_flags	= FS_USERNS_MOUNT,
};
3、挂载procfs入口:proc_mount->proc_fill_super,将procfs文件系统挂载到内核全局的VFS树中,调用proc_fill_super完成超级快的初始化工作
//https://elixir.bootlin.com/linux/v4.11.6/source/fs/proc/root.c#L88
static struct dentry *proc_mount(struct file_system_type *fs_type,
	int flags, const char *dev_name, void *data)
{
	struct pid_namespace *ns;

	if (flags & MS_KERNMOUNT) {
		ns = data;
		data = NULL;
	} else {
		ns = task_active_pid_ns(current);
	}

	return mount_ns(fs_type, flags, data, ns, ns->user_ns, proc_fill_super);
}
int proc_fill_super(struct super_block *s, void *data, int silent)
{
	struct pid_namespace *ns = get_pid_ns(s->s_fs_info);
	struct inode *root_inode;
	int ret;

	if (!proc_parse_options(data, ns))
		return -EINVAL;

	/* User space would break if executables or devices appear on proc */
	s->s_iflags |= SB_I_USERNS_VISIBLE | SB_I_NOEXEC | SB_I_NODEV;
	s->s_flags |= MS_NODIRATIME | MS_NOSUID | MS_NOEXEC;
	s->s_blocksize = 1024;
	s->s_blocksize_bits = 10;	// 必须是10,2^10=1024
	s->s_magic = PROC_SUPER_MAGIC;	 //magic number,宏的具体数字为0x9fa0
	s->s_op = &proc_sops;		// 具体的超级块操作,主要涉及的是索引块的操作
	s->s_time_gran = 1;

	s->s_stack_depth = FILESYSTEM_MAX_STACK_DEPTH;

	pde_get(&proc_root);
	root_inode = proc_get_inode(s, &proc_root);	// 转换为vfs具体能识别的索引节点
	if (!root_inode) {
		pr_err("proc_fill_super: get root inode failed\n");
		return -ENOMEM;
	}
	//https://elixir.bootlin.com/linux/v4.11.6/source/fs/dcache.c#L1855
	//初始化根节点,并且与super_block进行关联!
	s->s_root = d_make_root(root_inode);
	if (!s->s_root) {
		pr_err("proc_fill_super: allocate dentry failed\n");
		return -ENOMEM;
	}

	ret = proc_setup_self(s);
	if (ret) {
		return ret;
	}
	return proc_setup_thread_self(s);
}

enum {
    PROC_ROOT_INO = 1,
};

//https://elixir.bootlin.com/linux/v4.11.6/source/fs/proc/root.c#L204
struct proc_dir_entry proc_root = {
	.low_ino	= PROC_ROOT_INO, 	  // 根的索引节点号
	.namelen	= 5, 					 // 根文件名长度、文件名
	.mode		= S_IFDIR | S_IRUGO | S_IXUGO,
	.nlink		= 2,
	.count		= ATOMIC_INIT(1),
	.proc_iops	= &proc_root_inode_operations, 	// 根文件的具体索引节点操作
	.proc_fops	= &proc_root_operations,		// 根文件支持的文件操作
	.parent		= &proc_root,
	.subdir		= RB_ROOT,
	.name		= "/proc",
};
上面的proc_root节点不仅包含正常的文件及目录,还要管理进程指定的pid文件,proc_root必须能够处理inode和file,proc_root_inode_operations与proc_root_operations的定义如下:
static struct file_operations proc_root_operations = {
    .read        = generic_read_dir,
    .readdir     = proc_root_readdir,		//目录遍历
};

/*
 * proc root can do almost nothing..
 */
static struct inode_operations proc_root_inode_operations = {
    .lookup     = proc_root_lookup,			//对应vfs架构中的real_lookup函数
    .getattr    = proc_root_getattr,
};
proc_root_lookup:proc下的inode查找
当用户空间访问proc文件的时候(通过open系统调用打开/proc/xxxx时),vfs就会调用real_lookup(),它就会调用inode_operations中的proc_root_lookup函数,实际上就是调用proc_root_lookup()函数
在Linux 内核之旅(十一):追踪 open 系统调用文中,可以清晰的看到lookup调用这个过程
- case1:目录(中间)分量访问:
link_path_walk->walk_component->lookup_slow->...... - case2:文件(最后)分量访问:
do_last->lookup_open->......
//https://elixir.bootlin.com/linux/v4.11.6/source/fs/proc/root.c#L196
static const struct inode_operations proc_root_inode_operations = {
	.lookup		= proc_root_lookup,	//在`open` syscall中被调用
	.getattr	= proc_root_getattr,
};

//https://elixir.bootlin.com/linux/v4.11.6/source/fs/namei.c#L1625
static struct dentry *lookup_slow(const struct qstr *name,struct dentry *dir,unsigned int flags)
{
	struct dentry *dentry = ERR_PTR(-ENOENT), *old;
	struct inode *inode = dir->d_inode;

	inode_lock_shared(inode);
	......
again:
	dentry = d_alloc_parallel(dir, name, &wq);
	if (IS_ERR(dentry))
		goto out;
	if (unlikely(!d_in_lookup(dentry))) {
		.......
	} else {
		// 中间路径查找:调用lookup回调函数
		old = inode->i_op->lookup(inode, dentry, flags);
		d_lookup_done(dentry);
		if (unlikely(old)) {
			dput(dentry);
			dentry = old;
		}
	}
out:
	inode_unlock_shared(inode);
	return dentry;
}

//https://elixir.bootlin.com/linux/v4.11.6/source/fs/namei.c#L3146
static int lookup_open(struct nameidata *nd, struct path *path,
			struct file *file,
			const struct open_flags *op,
			bool got_write, int *opened)
{
	struct dentry *dir = nd->path.dentry;
	struct inode *dir_inode = dir->d_inode;	//父目录的inode
	......
no_open:
	if (d_in_lookup(dentry)) {
		//最后一个分量查找,调用父目录inode的方法查找子文件的元信息
		struct dentry *res = dir_inode->i_op->lookup(dir_inode, dentry,
							     nd->flags);
		d_lookup_done(dentry);
		if (unlikely(res)) {
			......
		}
	}
	......
}
在/proc/目录下进行查找,调用的lookup函数即proc_root_lookup:
//https://elixir.bootlin.com/linux/v4.11.6/source/fs/proc/root.c#L204
static struct dentry *proc_root_lookup(struct inode * dir, struct dentry * dentry, unsigned int flags)
{
	 // 先查找进程id相关的文件
	if (!proc_pid_lookup(dir, dentry, flags)){
		return NULL;
	}
	// 再查找内核运行状态的文件
	return proc_lookup(dir, dentry, flags);
}

//https://elixir.bootlin.com/linux/v4.11.6/source/fs/proc/generic.c#L251
struct dentry *proc_lookup(struct inode *dir, struct dentry *dentry,
		unsigned int flags)
{
	return proc_lookup_de(PDE(dir), dir, dentry);
}
proc_pid_lookup与proc_lookup的实现:
//在指定的pid文件夹中查找dentry是否存在
struct dentry *proc_pid_lookup(struct inode *dir, struct dentry * dentry, unsigned int flags)
{
	int result = -ENOENT;
	struct task_struct *task;
	unsigned tgid;
	struct pid_namespace *ns;

	// 检查目录是否为数字(快速失败)
	tgid = name_to_int(&dentry->d_name);
	if (tgid == ~0U)
		goto out;

	//有趣:获取对应的namespace
	ns = dentry->d_sb->s_fs_info;
	rcu_read_lock();
	//通过pid查找到指定的task
	task = find_task_by_pid_ns(tgid, ns);
	if (task)
		get_task_struct(task);
	rcu_read_unlock();
	if (!task)
		goto out;

	//生成一个新索引节点,并进行缓存
	result = proc_pid_instantiate(dir, dentry, task, NULL);
	put_task_struct(task);
out:
	return ERR_PTR(result);
}

//proc_lookup->proc_lookup_de
//https://elixir.bootlin.com/linux/v4.11.6/source/fs/proc/generic.c#L230
struct dentry *proc_lookup_de(struct proc_dir_entry *de, struct inode *dir,
		struct dentry *dentry)
{
	struct inode *inode;

	read_lock(&proc_subdir_lock);
	// 从dentry中提取出具体的proc_dir_entry
	de = pde_subdir_find(de, dentry->d_name.name, dentry->d_name.len);
	if (de) {
		//找到了
		pde_get(de);
		read_unlock(&proc_subdir_lock);
		inode = proc_get_inode(dir->i_sb, de);	// 获取对应的inode
		if (!inode)
			return ERR_PTR(-ENOMEM);
		d_set_d_op(dentry, &simple_dentry_operations); 	//老套路了,加入到dentry cache中
		d_add(dentry, inode);
		return NULL;
	}
	read_unlock(&proc_subdir_lock);
	return ERR_PTR(-ENOENT);
}
为什么proc_root_lookup中的设计要优先进程id其次再内核呢?这是考虑到进程目录数量远大于内核文件数量,先匹配高频访问如进程相关的查找(ps/top 等)比内核状态文件访问更频繁,其次快速失败机制如果查找的不是数字(非PID),proc_pid_lookup 会快速返回失败以切换到查找内核文件
file_operations:proc_root_readdir
proc_root_operations对应的.readdir实现为proc_root_readdir,该函数是procfs 文件系统根目录/proc/的目录遍历实现,它的作用是控制如何列出 /proc 目录下的内容
#define FIRST_PROCESS_ENTRY 256

//https://elixir.bootlin.com/linux/v4.11.6/source/fs/proc/root.c#L170
static int proc_root_readdir(struct file *file, struct dir_context *ctx)
{
    // 第一阶段:读取内核状态文件(静态文件)
    if (ctx->pos < FIRST_PROCESS_ENTRY) {
        int error = proc_readdir(file, ctx);  // 读取内核相关文件
        if (unlikely(error <= 0))
            return error;  // 出错或读取完成
        ctx->pos = FIRST_PROCESS_ENTRY;  // 切换到进程条目阶段
    }

    // 第二阶段:读取进程目录
    return proc_pid_readdir(file, ctx);  // 读取进程PID目录
}
系统中对于一个目录有多种读取子目录的方式(如ls和ls -al显示的结果不同),这是由传入过程中对file->f_ops设定不同的偏移决定的。对于/proc根目录而言:
f_ops = 0:为.目录链接,链接到自身f_ops = 1:为..目录链接,链接到父目录f_ops如果是在2~FIRST_PROCESS_ENTRY-1之间:表示/proc/下的静态目录或者静态文件f_ops如果是在FIRST_PROCESS_ENTRY~FIRST_PROCESS_ENTRY+ ARRAY_SIZE(proc_base_stuff)-1:为self子目录内容f_ops = FIRST_PROCESS_ENTRY+ ARRAY_SIZE(proc_base_stuff):为init_task即0号初始进程f_pos = PID_MAX_LIMIT + TGID_OFFSET:标识目录遍历结束
继续分析proc_pid_readdir的实现,该函数用于列出 /proc目录时生成进程列表,包括
- 特殊符号链接:
self、thread-self - 所有进程目录:
/proc/1、/proc/2等
int proc_pid_readdir(struct file *file, struct dir_context *ctx)
{
	struct tgid_iter iter;
	// pid_namespace 为pid结构的命名空间
	struct pid_namespace *ns = file_inode(file)->i_sb->s_fs_info;
	loff_t pos = ctx->pos;

	if (pos >= PID_MAX_LIMIT + TGID_OFFSET)
		return 0;

	if (pos == TGID_OFFSET - 2) {
		struct inode *inode = d_inode(ns->proc_self);
		//self
		if (!dir_emit(ctx, "self", 4, inode->i_ino, DT_LNK))
			return 0;
		ctx->pos = pos = pos + 1;
	}
	if (pos == TGID_OFFSET - 1) {
		struct inode *inode = d_inode(ns->proc_thread_self);
		if (!dir_emit(ctx, "thread-self", 11, inode->i_ino, DT_LNK))
			return 0;
		ctx->pos = pos = pos + 1;
	}
	iter.tgid = pos - TGID_OFFSET;
	iter.task = NULL;
	// next_tgid(ns, iter) 来寻找每一个pid(对应ns命名空间内的)
	for (iter = next_tgid(ns, iter);
	     iter.task;
	     iter.tgid += 1, iter = next_tgid(ns, iter)) {
		char name[PROC_NUMBUF];
		int len;

		cond_resched();
		if (!has_pid_permissions(ns, iter.task, HIDEPID_INVISIBLE))
			continue;

		len = snprintf(name, sizeof(name), "%d", iter.tgid);
		ctx->pos = iter.tgid + TGID_OFFSET;
		if (!proc_fill_cache(file, ctx, name, len,
				     proc_pid_instantiate, iter.task, NULL)) {
			put_task_struct(iter.task);
			return 0;
		}
	}
	// 标志着目录遍历结束
	ctx->pos = PID_MAX_LIMIT + TGID_OFFSET;
	return 0;
}
static struct tgid_iter next_tgid(struct pid_namespace *ns, struct tgid_iter iter)
{
	struct pid *pid;

	if (iter.task)
		put_task_struct(iter.task);
	rcu_read_lock();
retry:
	iter.task = NULL;
	pid = find_ge_pid(iter.tgid, ns);
	if (pid) {
		iter.tgid = pid_nr_ns(pid, ns);
		iter.task = pid_task(pid, PIDTYPE_PID);

		if (!iter.task || !has_group_leader_pid(iter.task)) {
			iter.tgid += 1;
			goto retry;
		}
		get_task_struct(iter.task);
	}
	rcu_read_unlock();
	return iter;
}

struct pid *find_ge_pid(int nr, struct pid_namespace *ns)
{
	struct pid *pid;

	do {
		// 在指定命名空间中查找精确的 PID
		pid = find_pid_ns(nr, ns);
		if (pid)
			break;	//说明找不到或者已经寻找完成
		// 在该命名空间的位图中查找下一个存在的 PID
		nr = next_pidmap(ns, nr);
	} while (nr > 0);

	return pid;
}

struct pid *find_pid_ns(int nr, struct pid_namespace *ns)
{
	struct upid *pnr;

	hlist_for_each_entry_rcu(pnr,
			&pid_hash[pid_hashfn(nr, ns)], pid_chain)
		if (pnr->nr == nr && pnr->ns == ns)
			return container_of(pnr, struct pid,
					numbers[ns->level]);

	return NULL;
}
inode_operations.lookup:目录下查找文件
下面列举几个典型的inode_operations封装,通过这些 inode_operations,内核定义了当在这些目录下查找文件(lookup)或获取属性(getattr)时该如何响应, 比如
- 在
/proc/根目录下,文件名可能是 cpuinfo(静态),也可能是123(动态 PID) - 在
/proc/[pid]/fd/下,文件名必须是数字(fd) - 在
/proc/[pid]/ns/下,文件名必须是特定的命名空间名称
1、proc_root_inode_operations,对应目录/proc/根目录,是整个 /proc 的入口,其proc_root_lookup承担了两种功能:
- 负责寻找静态项(如
meminfo/cpuinfo) - 负责找进程项(如果用户输入的字符串全是数字,它会去查 PID 列表并创建进程目录)
static const struct inode_operations proc_root_inode_operations = {
	.lookup		= proc_root_lookup,
	.getattr	= proc_root_getattr,
};
2、proc_dir_inode_operations:对应目录/proc/ 下的普通静态子目录,如/proc/sys/、/proc/net/、/proc/fs/等。此函数用于管理那些通过 proc_mkdir 创建的固定目录。它们的 lookup函数即proc_lookup,主要是在该目录的子节点链表(proc_dir_entry 树)中搜索匹配的文件名
//https://elixir.bootlin.com/linux/v4.11.6/source/fs/proc/generic.c#L328
static const struct inode_operations proc_dir_inode_operations = {
	.lookup		= proc_lookup,
	.getattr	= proc_getattr,
	.setattr	= proc_notify_change,
};
3、proc_fdinfo_inode_operations:对应目录/proc/[pid]/fdinfo/,提供比 /proc/[pid]/fd/ 更详细的读写位置(pos)、标志位(flags)等元数据
//https://elixir.bootlin.com/linux/v4.11.6/source/fs/proc/fd.c#L345
const struct inode_operations proc_fdinfo_inode_operations = {
	.lookup		= proc_lookupfdinfo,
	.setattr	= proc_setattr,
};

const struct file_operations proc_fdinfo_operations = {
	.read		= generic_read_dir,
	.iterate_shared	= proc_readfdinfo,
	.llseek		= generic_file_llseek,
};
4、proc_fd_inode_operations,对应目录为/proc/[pid]/fd/,此操作专门为查看进程打开的文件描述符而设计,主要包含如下实现:
lookup:会将数字(fd号)实时映射到内核的struct file对象permission:会检查是否有权查看该进程的fd(通常要求root或该进程的所有者)
//https://elixir.bootlin.com/linux/v4.11.6/source/fs/proc/fd.c#L300
const struct inode_operations proc_fd_inode_operations = {
	.lookup		= proc_lookupfd,
	.permission	= proc_fd_permission,
	.setattr	= proc_setattr,
};
5、proc_ns_dir_inode_operations:对应目录为/proc/[pid]/ns/(Namespace 目录),用于管理进程所属的各种命名空间(如 ipc、net、uts 等)
lookup:这里的每一个文件其实都是一个特殊的句柄,允许通过setns系统调用让当前进程进入目标进程的命名空间
//https://elixir.bootlin.com/linux/v4.11.6/source/fs/proc/namespaces.c#L175
const struct inode_operations proc_ns_dir_inode_operations = {
	.lookup		= proc_ns_dir_lookup,
	.getattr	= pid_getattr,
	.setattr	= proc_setattr,
};
0x04 pid_entry主要功能分析
TODO
0x05 /proc/下个几个典型实现
在示例说明前,先简单介绍下procfs读取(输出)数据的一些范式,大部分都遵从open then read机制,即如下流程:
1、open 阶段,主要完成:
- 权限校验
- 引用绑定:将
mm_struct的指针存入file->private_data(如proc_maps_private结构体) file_operation绑定- 此时不加
mmap_sem锁,因为现在只是打开文件,还没有真正开始读数据 - 对于可能较大的数据(文件),内核会采用
seq_read进制进行多次批量read
2、read 阶段 (seq_read -> m_start):可能多次调用
- 从
file->private_data结构体拿出需要的结构(如mm) - 加锁
down_read(&mm->mmap_sem) - 遍历并显示(如
show_map) - 释放锁:
up_read
例1:ls /proc/
ls /proc/输出为固定目录加上当前命名空间下可见的进程id的目录集合
例2:cat /proc/meminfo
/proc/meminfo 是典型的单文件只读实现,核心是通过内核中的 seq_file 接口,定义如下:
//https://elixir.bootlin.com/linux/v4.11.6/source/fs/proc/meminfo.c#L45
static int meminfo_proc_open(struct inode *inode, struct file *file)
{
	// 绑定展示函数 meminfo_proc_show
	return single_open(file, meminfo_proc_show, NULL);
}

static const struct file_operations meminfo_proc_fops = {
	.open		= meminfo_proc_open,
	.read		= seq_read,	//标准的序列化读取函数
	.llseek		= seq_lseek,
	.release	= single_release,
};

// 在内核初始化时创建 /proc/meminfo 节点
static int __init proc_meminfo_init(void)
{
	proc_create("meminfo", 0, NULL, &meminfo_proc_fops);
	return 0;
}
fs_initcall(proc_meminfo_init);
可以从下面三个方面来分析下这个实现:
1、meminfo数据的源头来源:内核中关于内存统计信息(分布在内存管理的各个子系统),即全局变量和计数器(如 totalram_pages、active_anon_pages 等)
2、核心回调函数的实现是meminfo_proc_show,在用户态执行 cat /proc/meminfo 时,内核会通过以下链路触发这个函数
open系统调用打开文件,完成将文件名与回调函数的关联,关联内核函数meminfo_proc_open- 用户态系统调用
read()->vfs_read(),当进入到VFS层vfs_read函数时触发回调,由于该文件的file_operations绑定了seq_read,内核最终会调用meminfo_proc_show meminfo_proc_show函数实现最终的内容生成:函数内部会调用si_meminfo()获取系统整体内存快照(短暂采样),然后使用seq_printf将这些数据格式化为字符串
static inline unsigned long global_page_state(enum zone_stat_item item)
{
	long x = atomic_long_read(&vm_zone_stat[item]);
	return x;
}

// si_meminfo:短暂采样
void si_meminfo(struct sysinfo *val)
{
	val->totalram = totalram_pages;
	val->sharedram = global_node_page_state(NR_SHMEM);
	val->freeram = global_page_state(NR_FREE_PAGES);	//sample
	val->bufferram = nr_blockdev_pages();
	val->totalhigh = totalhigh_pages;
	val->freehigh = nr_free_highpages();
	val->mem_unit = PAGE_SIZE;
}

//https://elixir.bootlin.com/linux/v4.11.6/source/fs/proc/meminfo .c#L45
static int meminfo_proc_show(struct seq_file *m, void *v)
{
	struct sysinfo i;
	unsigned long committed;
	long cached;
	long available;
	unsigned long pages[NR_LRU_LISTS];
	int lru;

	si_meminfo(&i);
	si_swapinfo(&i);
	committed = percpu_counter_read_positive(&vm_committed_as);

	cached = global_node_page_state(NR_FILE_PAGES) -
			total_swapcache_pages() - i.bufferram;
	if (cached < 0)
		cached = 0;

	for (lru = LRU_BASE; lru < NR_LRU_LISTS; lru++)
		pages[lru] = global_node_page_state(NR_LRU_BASE + lru);

	available = si_mem_available();

	show_val_kb(m, "MemTotal:       ", i.totalram);
	show_val_kb(m, "MemFree:        ", i.freeram);
	show_val_kb(m, "MemAvailable:   ", available);
	show_val_kb(m, "Buffers:        ", i.bufferram);
	show_val_kb(m, "Cached:         ", cached);
	show_val_kb(m, "SwapCached:     ", total_swapcache_pages());
	show_val_kb(m, "Active:         ", pages[LRU_ACTIVE_ANON] +
					   pages[LRU_ACTIVE_FILE]);
	......


	hugetlb_report_meminfo(m);

	arch_report_meminfo(m);

	return 0;
}
ls /proc/${pid}/fd
TODO
cat /proc/${pid}/maps
cat /proc/[pid]/maps可以查看某个进程的虚拟内存布局情况(该例子展示了内核如何将复杂的内存管理数据结构红黑树、链表等实时翻译成文本),这里主要是遍历对应进程的虚拟内存区的vma
1、结构回调函数注册,由于/proc/[pid]/maps的特殊性,所以需要采用seq_read的方式来进行,即执行 cat /proc/3902517/maps 时,内核并不会一次性生成整个文件,而是利用 seq_file 机制按需、分步地迭代内存区域。原因如前描述,由于 maps 可能会非常大,seq_file机制允许内核只生成一部分数据填满 buffer 传给用户,等用户下次 read 时,再从上一个 VMA 的位置继续迭代
static int show_pid_map(struct seq_file *m, void *v)
{
	//最终调用了show_map处理
	return show_map(m, v, 1);
}

// 重要:seq_operations的控制
static const struct seq_operations proc_pid_maps_op = {
	.start	= m_start,
	.next	= m_next,
	.stop	= m_stop,
	.show	= show_pid_map
};

static int pid_maps_open(struct inode *inode, struct file *file)
{
	return do_maps_open(inode, file, &proc_pid_maps_op);
}

const struct file_operations proc_pid_maps_operations = {
	.open		= pid_maps_open,
	.read		= seq_read,
	.llseek		= seq_lseek,
	.release	= proc_map_release,
};
注意到proc_pid_maps_op这个变量中定义的四个成员(seq_operations控制函数),它完成了在读取过程的中的关键输出环节(除了open):
open->read->vfs_read:绑定进程的mm_struct到文件句柄,确定要观察哪个进程的内存,进而触发系统调用read,然后在内核 VFS 层通过proc_pid_maps_operations找到该文件绑定的seq_readm_start:获取mmap_lock锁,保证读取时内存布局不被修改m_next:遍历vm_area_struct链表/红黑树,找到下一个内存区间VMAm_show[show_pid_map]:调用show_map_vma格式化字符串,将内核 VMA 信息转为文本m_stop:释放mmap_lock锁,允许进程继续修改自己的内存,输出完成
2、open过程分析:绑定进程的 mm_struct 到文件句柄,定位到task_struct(哪个进程的内存布局)
先着重跟踪下pid_maps_open的实现,对应于proc_pid_maps_operations[file_operations]中对于open的关联,即调用syscall open打开/proc/[pid]/maps时,会调用pid_maps_open函数。pid_maps_open 的目的是找到该进程对应的 mm_struct,并确保在接下来的读取过程中,这个 mm 对象不会被销毁(依赖于mmgrab与mmput机制保证)
static int pid_maps_open(struct inode *inode, struct file *file)
{
	return do_maps_open(inode, file, &proc_pid_maps_op);
}

static int do_maps_open(struct inode *inode, struct file *file,
			const struct seq_operations *ops)
{
	return proc_maps_open(inode, file, ops,
				sizeof(struct proc_maps_private));
}

// 注意这个结构体
struct proc_maps_private {
	struct inode *inode;
	struct task_struct *task;
	struct mm_struct *mm;
#ifdef CONFIG_MMU
	struct vm_area_struct *tail_vma;
#endif
#ifdef CONFIG_NUMA
	struct mempolicy *task_mempolicy;
#endif
};

//https://elixir.bootlin.com/linux/v4.11.6/source/fs/proc/task_mmu.c#L227
static int proc_maps_open(struct inode *inode, struct file *file,
			const struct seq_operations *ops, int psize)
{
	struct proc_maps_private *priv = __seq_open_private(file, ops, psize);

	if (!priv)
		return -ENOMEM;

	priv->inode = inode;
	// 根据inode
	priv->mm = proc_mem_open(inode, PTRACE_MODE_READ);
	if (IS_ERR(priv->mm)) {
		int err = PTR_ERR(priv->mm);

		seq_release_private(inode, file);
		return err;
	}

	return 0;
}

//核心函数
struct mm_struct *proc_mem_open(struct inode *inode, unsigned int mode)
{
	//1.身份定位:从 inode 到 task_struct
	//在 /proc 文件系统中,每个文件(如 /proc/1234/maps)的 inode 里都记录了它所属进程的信息
	struct task_struct *task = get_proc_task(inode);
	struct mm_struct *mm = ERR_PTR(-ESRCH);

	if (task) {
		/*
		2.	安全检查:mm_access 的守护
		这是最关键的一步。内核不会随便让一个进程读取另一个进程的内存映射,因为这涉及敏感信息(如库加载地址、堆栈位置,可用于安全攻击)
    	2.1 cred_guard_mutex: 获取互斥锁,防止在检查权限时进程执行 exec(这会导致凭据 credentials 变化)
	    2.2 ptrace_may_access: 进行 PTRACE 权限检查。如果权限不足(比如你尝试看 root 进程的 maps),这里会返回 -EACCES
	    2.3 get_task_mm: 如果权限通过,增加 mm_struct 的引用计数(mm_users),确保 mm 在读取期间有效
		*/
		mm = mm_access(task, mode | PTRACE_MODE_FSCREDS);
		put_task_struct(task);

		/*
		3. 引用计数机制:mmgrab vs mmput
		- mm_users (通过 mmput 操作): 对应的是页表和内存资源。如果 mm_users 降为 0,内核会释放该进程占用的所有物理内存和页表
		- mm_count (通过 mmgrab 操作): 对应的是 mm_struct 结构体本身。只要 mm_count > 0,即使进程退出了,mm_struct 这个结构体对象在内存中就不会被 kmem_cache_free 掉
		*/
		if (!IS_ERR_OR_NULL(mm)) {
			/* ensure this mm_struct can't be freed */
			mmgrab(mm);	// 增加 mm_count
			/* but do not pin its memory */
			mmput(mm);	// 减少 mm_users
		}
	}

	return mm;
}

struct mm_struct *mm_access(struct task_struct *task, unsigned int mode)
{
	struct mm_struct *mm;
	int err;

	err =  mutex_lock_killable(&task->signal->cred_guard_mutex);
	if (err)
		return ERR_PTR(err);

	// 重要!根据task_struct获取mm_struct
	mm = get_task_mm(task);
	if (mm && mm != current->mm &&
			!ptrace_may_access(task, mode)) {
		mmput(mm);
		mm = ERR_PTR(-EACCES);
	}
	mutex_unlock(&task->signal->cred_guard_mutex);

	return mm;
}
上面这段代码中,get_proc_task这个函数有点意思,为何可以通过inode指针获取到进程结构task_struct呢?关键点如下:
struct proc_inode加container_of机制:拿到proc_inode中的struct pid *成员- 通过
struct pid拿到对应的struct task_struct
这里简单描述下查找过程,在procfs中,每一个文件或目录(inode)实际上都关联在某个进程的 pid 结构(struct pid)上
1、关键的数据结构proc_inode(前文已述),当通过 open 打开 /proc/[pid]/maps 时,内核已经通过路径查找定位到了对应的 inode,而 procfs 的 inode 在创建时(如进程启动后,用户首次访问其 proc 目录),就已经把该进程的 struct pid 指针存入了 proc_inode 的pid成员中
struct proc_inode {
	......
    struct pid *pid;    // 这里的 pid 结构是关联的关键
    struct inode vfs_inode;
};
2、通过proc_pid(inode) 提取 PID 结构,利用了 container_of 宏,从 vfs_inode 的地址倒推出 proc_inode 的首地址,从而拿到 pid 指针。struct pid *是内核对 PID 的抽象结构(PID 抽象层即内核引入 struct pid 是为了处理命名空间(Namespace)。同一个进程在不同的 PID Namespace 里有不同的数字 PID。struct pid 作为一个中介,可以跨 Namespace 稳定地引用进程)
// proc_pid:获取预存的 pid 结构体指针
static inline struct pid *proc_pid(const struct inode *inode)
{
    // 从 inode 指针转换回 proc_inode,并返回其中的 pid
    return PROC_I(inode)->pid;
}
3、通过pid对象,调用get_pid_task 转换为 task_struct
struct task_struct *get_pid_task(struct pid *pid, enum pid_type type)
{
    struct task_struct *result;
    rcu_read_lock(); // 进入 RCU 临界区,保证 task 不会在查找期间被释放

    // 从 pid 结构中找到 task 指针
	// 会根据 pid 结构体中的散列表或链表找到 task_struct
    result = pid_task(pid, type);

    if (result)
        get_task_struct(result); //非常重要:增加 task_struct 的引用计数,防止它在后续使用中消失

    rcu_read_unlock();
    return result;
}

// pid_task:通过内核的 PID 管理机制(hashtable查找),找到该 PID 当前对应的进程描述符 task_struct
struct task_struct *pid_task(struct pid *pid, enum pid_type type)
{
	struct task_struct *result = NULL;
	if (pid) {
		struct hlist_node *first;
		first = rcu_dereference_check(hlist_first_rcu(&pid->tasks[type]),
					      lockdep_tasklist_lock_is_held());
		if (first)
			result = hlist_entry(first, struct task_struct, pids[(type)].node);
	}
	return result;
}
这里有一处内核的并发细节实现,注意上面get_pid_task-->pid_task的调用路径上的rcu_read_lock/rcu_read_unlock操作以及pid_task中的lockdep_tasklist_lock_is_held,对于lockdep_tasklist_lock_is_held而言,如果要调用函数pid_task,必须遵循如下两种范式:
1、范式一,RCU 读者(最常见,高性能),典型函数实现如 proc_fd_permission、get_proc_task_net、kill_pid_info等
rcu_read_lock();
// 通过 pid 获取 task
struct task_struct *task = pid_task(pid, PIDTYPE_PID);
if (task) {
    // 只能在临界区内使用 task,且不能睡眠
	......
    printk("Task name: %s\n", task->comm);
}
rcu_read_unlock();
2、范式二,持有全局锁(写操作),典型的操作如zap_pid_ns_processes
read_lock(&tasklist_lock);
struct task_struct *task = pid_task(pid, PIDTYPE_PID);
// 操作 task...
read_unlock(&tasklist_lock);
所以,这里核心查找路径是inode->proc_inode->[struct pid]->task_struct
//https://elixir.bootlin.com/linux/v6.18.3/source/fs/proc/internal.h#L142
static inline struct pid *proc_pid(const struct inode *inode)
{
	// 根据vfs_node获取到对应的pid结构
	return PROC_I(inode)->pid;
}

static inline struct task_struct *get_proc_task(const struct inode *inode)
{
	//  从 inode 指针转换回 proc_inode,并返回其中的 pid
	//  PIDTYPE_PID:指定要找的是该 PID 对应的进程实体(而不是进程组长或会话组长)
	return get_pid_task(proc_pid(inode), PIDTYPE_PID);
}

//https://elixir.bootlin.com/linux/v6.18.3/source/kernel/pid.c#L466
struct task_struct *get_pid_task(struct pid *pid, enum pid_type type)
{
	struct task_struct *result;
	rcu_read_lock();
	result = pid_task(pid, type);
	if (result)
		get_task_struct(result);
	rcu_read_unlock();
	return result;
}

//https://elixir.bootlin.com/linux/v6.18.3/source/kernel/pid.c#L414
struct task_struct *pid_task(struct pid *pid, enum pid_type type)
{
	struct task_struct *result = NULL;
	if (pid) {
		struct hlist_node *first;
		first = rcu_dereference_check(hlist_first_rcu(&pid->tasks[type]),
					      lockdep_tasklist_lock_is_held());
		if (first)
			result = hlist_entry(first, struct task_struct, pid_links[(type)]);
	}
	return result;
}

//https://elixir.bootlin.com/linux/v6.18.3/source/include/linux/sched/task.h#L114
static inline struct task_struct *get_task_struct(struct task_struct *t)
{
	refcount_inc(&t->usage);
	return t;
}
3、m_start:如前文描述,proc_pid_maps_op 使用了 seq_file 接口,整个遍历过程是由 start/next/show/stop 四个步骤组成的,这里先分析下m_start。当开始读取 maps 文件时,m_start 会被调用。注意到m_start会尝试加读锁mmap_sem(较新的内核版本中,m_start 会尝试获取 mm_struct 的 mmap_lock),而在m_stop函数中,当一次read读取周期结束或报错时,m_stop 会释放这个锁。而show_map 处于 m_start 和 m_stop 划定的临界区之内,自然不需要重复加锁
另外,在本文的内核版本中,使用 down_read(&mm->mmap_sem)这个锁的粒度不是基于单个 VMA,而是基于整个进程的地址空间(mm_struct)的
- 读锁(Read Lock):
cat /proc/[pid]/maps持有的是读锁 - 写锁(Write Lock):任何导致 VMA 增加或减少的操作(如
mmap/munmap/mprotect等)都必须获取写锁
由于读写锁的互斥特性,只要 m_start 拿到了读锁,直到 m_stop 释放锁之前,任何试图修改 VMA 链表的写操作都会被阻塞
//https://elixir.bootlin.com/linux/v4.11.6/source/fs/proc/task_mmu.c#L154
static void *m_start(struct seq_file *m, loff_t *ppos)
{
	struct proc_maps_private *priv = m->private;
	//m->version:比较重要的字段,代码里把 vma->vm_start 赋值给 version
	//这是为了在读取大文件触发多次read调用后,下次read之时能根据地址找回上次读取的位置
	unsigned long last_addr = m->version;
	struct mm_struct *mm;
	struct vm_area_struct *vma;
	unsigned int pos = *ppos;

	/* See m_cache_vma(). Zero at the start or after lseek. */
	if (last_addr == -1UL)
		return NULL;

	priv->task = get_proc_task(priv->inode);
	if (!priv->task)
		return ERR_PTR(-ESRCH);

	mm = priv->mm;
	//mmget_not_zero(mm):在加锁前,先确保 mm_struct 仍然有效(引用计数不为 0),防止在加锁瞬间进程已经彻底销毁
	if (!mm || !mmget_not_zero(mm))
		return NULL;

	//注意:加读锁,mmap_sem是一个读写信号量
	down_read(&mm->mmap_sem);
	hold_task_mempolicy(priv);
	priv->tail_vma = get_gate_vma(mm);

	if (last_addr) {
		// 寻找起始的 VMA
		vma = find_vma(mm, last_addr - 1);
		if (vma && vma->vm_start <= last_addr)
			vma = m_next_vma(priv, vma);
		if (vma)
			return vma;
	}

	m->version = 0;
	if (pos < mm->map_count) {
		for (vma = mm->mmap; pos; pos--) {
			m->version = vma->vm_start;
			vma = vma->vm_next;
		}
		return vma;
	}

	/* we do not bother to update m->version in this case */
	if (pos == mm->map_count && priv->tail_vma)
		return priv->tail_vma;

	vma_stop(priv);
	return NULL;
}
4、m_next:通过vma双向链表遍历到下一个节点
static void *m_next(struct seq_file *m, void *v, loff_t *pos)
{
	struct proc_maps_private *priv = m->private;
	struct vm_area_struct *next;

	(*pos)++;
	next = m_next_vma(priv, v);
	if (!next)
		vma_stop(priv);
	return next;
}


static struct vm_area_struct *
m_next_vma(struct proc_maps_private *priv, struct vm_area_struct *vma)
{
	if (vma == priv->tail_vma)
		return NULL;
	return vma->vm_next ?: priv->tail_vma;
}
5、m_show[show_pid_map]:处理单个vma(在锁的保护下),注意show_map_vma中对stack、heap区域的识别函数
vma->vm_start和vma->vm_end:地址范围vma->vm_flags:权限rwxpvma->vm_pgoff:偏移量- 如果 VMA 关联了文件,它还会通过
vma->vm_file去找文件名
//https://elixir.bootlin.com/linux/v4.11.6/source/fs/proc/task_mmu.c#L361
static int show_map(struct seq_file *m, void *v, int is_pid)
{
	show_map_vma(m, v, is_pid);
	m_cache_vma(m, v);
	return 0;
}

static void
show_map_vma(struct seq_file *m, struct vm_area_struct *vma, int is_pid)
{
	struct mm_struct *mm = vma->vm_mm;
	struct file *file = vma->vm_file;
	struct proc_maps_private *priv = m->private;
	vm_flags_t flags = vma->vm_flags;
	unsigned long ino = 0;
	unsigned long long pgoff = 0;
	unsigned long start, end;
	dev_t dev = 0;
	const char *name = NULL;

	if (file) {
		struct inode *inode = file_inode(vma->vm_file);
		dev = inode->i_sb->s_dev;
		ino = inode->i_ino;
		pgoff = ((loff_t)vma->vm_pgoff) << PAGE_SHIFT;
	}

	/* We don't show the stack guard page in /proc/maps */
	start = vma->vm_start;
	if (stack_guard_page_start(vma, start))
		start += PAGE_SIZE;
	end = vma->vm_end;
	if (stack_guard_page_end(vma, end))
		end -= PAGE_SIZE;

	seq_setwidth(m, 25 + sizeof(void *) * 6 - 1);
	seq_printf(m, "%08lx-%08lx %c%c%c%c %08llx %02x:%02x %lu ",
			start,
			end,
			flags & VM_READ ? 'r' : '-',
			flags & VM_WRITE ? 'w' : '-',
			flags & VM_EXEC ? 'x' : '-',
			flags & VM_MAYSHARE ? 's' : 'p',
			pgoff,
			MAJOR(dev), MINOR(dev), ino);

	/*
	 * Print the dentry name for named mappings, and a
	 * special [heap] marker for the heap:
	 */
	if (file) {
		seq_pad(m, ' ');
		seq_file_path(m, file, "\n");
		goto done;
	}

	if (vma->vm_ops && vma->vm_ops->name) {
		name = vma->vm_ops->name(vma);
		if (name)
			goto done;
	}

	name = arch_vma_name(vma);
	if (!name) {
		if (!mm) {
			name = "[vdso]";
			goto done;
		}

		if (vma->vm_start <= mm->brk &&
		    vma->vm_end >= mm->start_brk) {
			name = "[heap]";
			goto done;
		}

		if (is_stack(priv, vma))
			name = "[stack]";
	}

done:
	if (name) {
		seq_pad(m, ' ');
		seq_puts(m, name);
	}
	seq_putc(m, '\n');
}
6、m_stop
//https://elixir.bootlin.com/linux/v4.11.6/source/fs/proc/task_mmu.c#L215
static void m_stop(struct seq_file *m, void *v)
{
	struct proc_maps_private *priv = m->private;

	if (!IS_ERR_OR_NULL(v))
		vma_stop(priv);
	if (priv->task) {
		put_task_struct(priv->task);	// 重要:减少 task 引用计数
		priv->task = NULL;
	}
}

static void vma_stop(struct proc_maps_private *priv)
{
	struct mm_struct *mm = priv->mm;

	release_task_mempolicy(priv);
	up_read(&mm->mmap_sem);		//释放锁
	mmput(mm);	// 减少 mm 的引用计数
}
这里总结下,上面的读取流程,当打开/proc/[pid]/maps文件,在用户态调用 read(fd, buf, size) 时,内核进入 seq_read函数,其逻辑大致如下:
m_start(只调用一次)- 执行
down_read(&mm->mmap_sem),加锁,此时进程的 VMA 链表被锁定,任何写操作都无法进入 - 根据
ppos找到本次读取的起始 VMA
- 执行
show/m_next(可能循环多次)show:把 VMA 信息(地址、权限等)格式化成字符串,填入内核的seq_file缓冲区m_next:指针移动到下一个 VMA- 退出条件:如果缓冲区填满了,或者 VMA 遍历完了,循环停止
m_stop(只调用一次)- 执行
up_read(&mm->mmap_sem),解锁 - 将
m->version更新为当前 VMA 的地址,方便下次read进来时找回位置
- 执行
- 最后内核将缓冲区的数据copy到用户态 buf 中,
read系统调用结束
所以,这就保证了在一次 read() 返回的数据中,所有的 VMA 信息是绝对同步的(锁保护),因为有 m_start 拿住的读锁,show_map 访问这些字段时,不需要担心 vma 对象本身被销毁或者这些字段被并发修改。但是,一个有趣的边界情况是,如果一个进程有非常多的 VMA(cat /proc/pid/maps 运行耗时较久),为了不让写者饿死,seq_file 机制在读取大数据量时,可能会在多次 read 系统调用之间释放并重新获取锁,如此内核引入了 m->version(记录上一次读取到的 vm_start 地址)来解决,这种设计体现了数据的断点续传,同时也保证了对写着的公平竞争的特点。即内核哲学之一,内核优先保证系统不崩溃(通过重新定位指针),而不强制保证输出的绝对完美快照(除非一次性读完所有数据)
- 现场恢复:当
m_start第二次被调用时,它会检查m->version,此值保存了上一次读取到的最后一个 VMA 的起始地址(vm_start) - 重新定位:
m_start会调用find_vma(mm, last_addr)来寻找下一个VMA,即便原来的 VMA 被删除了,find_vma也能找到地址空间中紧接着那个位置的下一个 VMA
对写方的公平竞争体现在:
- 释放锁,给写者机会修改 VMA
- 重新获取锁,通过
find_vma(mm, last_addr)重新定位 - 如果 VMA 真的变了,用户看到的输出可能是跳跃的,但这保证了内核不会崩溃
0x05 proc 函数钩子实例分析(进程属性相关)
proc_pid_limit的实现
/proc/x/limits实时反映当前进程的资源限制
[root@VM-X-X-centos ]# cat /proc/4124608/limits

/* Display limits for a process */
static int proc_pid_limits(struct seq_file *m, struct pid_namespace *ns,
			   struct pid *pid, struct task_struct *task)
{
	unsigned int i;
	unsigned long flags;

	struct rlimit rlim[RLIM_NLIMITS];

	if (!lock_task_sighand(task, &flags))
		return 0;
	memcpy(rlim, task->signal->rlim, sizeof(struct rlimit) * RLIM_NLIMITS);
	unlock_task_sighand(task, &flags);

	/*
	 * print the file header
	 */
       seq_printf(m, "%-25s %-20s %-20s %-10s\n",
		  "Limit", "Soft Limit", "Hard Limit", "Units");

	for (i = 0; i < RLIM_NLIMITS; i++) {
		if (rlim[i].rlim_cur == RLIM_INFINITY)
			seq_printf(m, "%-25s %-20s ",
				   lnames[i].name, "unlimited");
		else
			seq_printf(m, "%-25s %-20lu ",
				   lnames[i].name, rlim[i].rlim_cur);

		if (rlim[i].rlim_max == RLIM_INFINITY)
			seq_printf(m, "%-20s ", "unlimited");
		else
			seq_printf(m, "%-20lu ", rlim[i].rlim_max);

		if (lnames[i].unit)
			seq_printf(m, "%-10s\n", lnames[i].unit);
		else
			seq_putc(m, '\n');
	}

	return 0;
}
proc_pid_cmdline的实现
/proc/x/cmdline记录了进程启动时的完整命令行参数
[root@VM-X-X-centos X]# cat /proc/4124608/cmdline
sudosu-root
对应的VFS read实现方法proc_pid_cmdline:通过该方法获取进程对应的cmdline文件的信息
static int proc_pid_cmdline(struct task_struct *task, char * buffer)
{
    int res = 0;
    unsigned int len;
    struct mm_struct *mm = get_task_mm(task);
    if (!mm)
        goto out;
    if (!mm->arg_end)
        goto out_mm;    /* Shh! No looking before we're done */

    // 获取所有参数的个数
    len = mm->arg_end - mm->arg_start;

    if (len > PAGE_SIZE)
        len = PAGE_SIZE;

    // 获取第一个参数
    res = access_process_vm(task, mm->arg_start, buffer, len, 0);

    // If the nul at the end of args has been overwritten, then
    // assume application is using setproctitle(3).
    // 循环获取所有的参数
    if (res > 0 && buffer[res-1] != '\0' && len < PAGE_SIZE) {
        len = strnlen(buffer, res);
        if (len < res) {
            res = len;
        } else {
            len = mm->env_end - mm->env_start;
            if (len > PAGE_SIZE - res)
                len = PAGE_SIZE - res;
            // 获取参数,拼接参数得到cmdline
            res += access_process_vm(task, mm->env_start, buffer+res, len, 0);
            res = strnlen(buffer, res);
        }
    }
out_mm:
    mmput(mm);
out:
    return res;
}
0x06 proc 函数钩子实例分析(进程内存相关)
先梳理下进程的内存统计的背景知识,业务进程使用的内存主要有以下几种情况(其中前两者算作进程的RSS,后两者属于page cache)
- 用户空间的匿名映射页(Anonymous pages in User Mode address spaces):比如调用
malloc分配的内存,以及使用MAP_ANONYMOUS的mmap等场景;当系统内存不够时,内核可以将这部分内存交换出去 - 用户空间的文件映射页(Mapped pages in User Mode address spaces):包含map file和map tmpfs;前者比如指定文件的
mmap,后者比如IPC共享内存;当系统内存不够时,内核可以回收这些页,但回收之前可能需要与文件同步数据 - 文件缓存(page in page cache of disk file):发生在程序通过普通的
read/write读写文件时,当系统内存不够时,内核可以回收这些页,但回收之前可能需要与文件同步数据 - buffer pages,属于page cache:比如读取块设备文件
本小节汇总下与内存相关的几个proc文件
/proc/[pid]/stat/proc/[pid]/statm
VSS/RSS/PSS/USS
VSS:(Virtual Set Size)虚拟耗用内存(包含共享库占用的内存),即是进程向系统申请的虚拟内存(包含共享库内存总数),即单个进程全部可访问的地址空间,其大小可能包括还尚未在内存中驻留的部分RSS:(Resident Set Size)常驻内存大小,表示进程实际使用物理内存;是进程在 RAM 中实际保存的总内存(包含共享库占用的共享内存总数)。这个值经常用于进程内存监控,不过有一点需要关注:RSS包含了共享库占用的共享内存总数,然而实际上一个共享库仅会被加载到内存中一次,无论被多少个进程使用PSS:(Proportional Set Size) 实际使用的物理内存(比例分配共享库占用的内存),是单个进程运行时实际占用的物理内存(包含比例分配共享库占用的内存)。对比RSS来说,PSS中的共享库内存是按照比例计算的(若一个共享库有N个进程使用,那么该库比例分配给PSS的大小为1/N),即PSS明确的表示了单个进程在系统总内存中的实际使用量USS:(Unique Set Size) 进程独自占用的物理内存(不包含共享库占用的内存),是进程实际独自占用的物理内存(不包含共享库占用的内存)。USS揭示了单个进程运行中真实的内存增量大小。如果单个进程终止,USS就是实际返还给系统的内存大小
一般来说内存占用大小有如下规律:VSS >= RSS >= PSS >= USS
do_task_stat的实现:/proc/[pid]/stat
/proc/[pid]/stat相关的输出字段:
(23) vsize  %lu
        Virtual memory size in bytes.
(24) rss  %ld
        Resident Set Size: number of pages the process has
        in real memory.  This is just the pages which count
        toward text, data, or stack space.  This does not
        include pages which have not been demand-loaded in,
        or which are swapped out.
对应的内核函数为do_task_stat,rss列的计算函数为get_mm_rss,可见RSS的计算包含了MM_FILEPAGES/MM_ANONPAGES/MM_SHMEMPAGES(单位:页)
static inline unsigned long get_mm_rss(struct mm_struct *mm)
{
	return get_mm_counter(mm, MM_FILEPAGES) +
		get_mm_counter(mm, MM_ANONPAGES) +
		get_mm_counter(mm, MM_SHMEMPAGES);
}
注意到,/proc/[pid]/stat的RSS值与/proc/[pid]/statm输出的RSS是相等的
[root@VM-x-x-centos memory]# cat /proc/3447782/stat | awk '{print "RSS(page):", $24}'
RSS(page): 22811
[root@VM-218-158-centos memory]# cat /proc/3447782/statm
330060 22811 3727 1320 0 33217 0
proc_pid_statm的实现
/proc/${PID}/statm 用于记录指定进程的内存使用情况,所有数值以 内存页(Page)为单位(1 页通常为 4 KB),关联内核函数为proc_pid_statm,即当用户态读取 /proc/${PID}/statm 时,内核通过虚拟文件系统(VFS)触发该函数
Provides information about memory usage, measured in pages.
The columns are:

  size       (1) total program size
             (same as VmSize in /proc/[pid]/status)
  resident   (2) resident set size
             (same as VmRSS in /proc/[pid]/status)
  share      (3) shared pages (i.e., backed by a file)
  text       (4) text (code)
  lib        (5) library (unused in Linux 2.6)
  data       (6) data + stack
  dt         (7) dirty pages (unused in Linux 2.6)
[root@VM-X-X-centos ~]# cat /proc/3447782/statm
329932/size/ 21419/resident/ 2538/share/ 1320/text/ 0 32065/data/ 0

#size:进程的虚拟内存总量(包括物理内存、交换区、未映射内存等)
#resident:实际驻留物理内存的大小(RSS),即进程当前使用的物理内存
#share:与其他进程共享的物理内存(如共享库、共享内存段)
#text:代码段(可执行指令)占用的物理内存(所有进程共享同一程序的代码段时,此值可能重复计算)
#data:数据段(全局变量、静态数据)和堆栈占用的物理内存(反映进程的堆内存和栈内存使用)
proc_pid_statm函数的实现如下,注意get_mm_counter函数的作用是读取mm_struct结构体的成员数组计数mm->rss_stat.count[index]
static inline unsigned long get_mm_counter(struct mm_struct *mm, int member)
{
	long val = atomic_long_read(&mm->rss_stat.count[member]);

#ifdef SPLIT_RSS_COUNTING
	/*
	 * counter is updated in asynchronous manner and may go to minus.
	 * But it's never be expected number for users.
	 */
	if (val < 0)
		val = 0;
#endif
	return (unsigned long)val;
}

unsigned long task_statm(struct mm_struct *mm,
			 unsigned long *shared, unsigned long *text,
			 unsigned long *data, unsigned long *resident)
{
	*shared = get_mm_counter(mm, MM_FILEPAGES) +
			get_mm_counter(mm, MM_SHMEMPAGES);
	*text = (PAGE_ALIGN(mm->end_code) - (mm->start_code & PAGE_MASK))
								>> PAGE_SHIFT;
	*data = mm->data_vm + mm->stack_vm;
	*resident = *shared + get_mm_counter(mm, MM_ANONPAGES);
	return mm->total_vm;
}

int proc_pid_statm(struct seq_file *m, struct pid_namespace *ns,
			struct pid *pid, struct task_struct *task)
{
	unsigned long size = 0, resident = 0, shared = 0, text = 0, data = 0;
	struct mm_struct *mm = get_task_mm(task);

	if (mm) {
		size = task_statm(mm, &shared, &text, &data, &resident);
		mmput(mm);
	}
	/*
	 * For quick read, open code by putting numbers directly
	 * expected format is
	 * seq_printf(m, "%lu %lu %lu %lu 0 %lu 0\n",
	 *               size, resident, shared, text, data);
	 */
	seq_put_decimal_ull(m, "", size);
	seq_put_decimal_ull(m, " ", resident);
	seq_put_decimal_ull(m, " ", shared);
	seq_put_decimal_ull(m, " ", text);
	seq_put_decimal_ull(m, " ", 0);	//废弃
	seq_put_decimal_ull(m, " ", data);
	seq_put_decimal_ull(m, " ", 0);	//废弃
	seq_putc(m, '\n');

	return 0;
}