0x00 前言
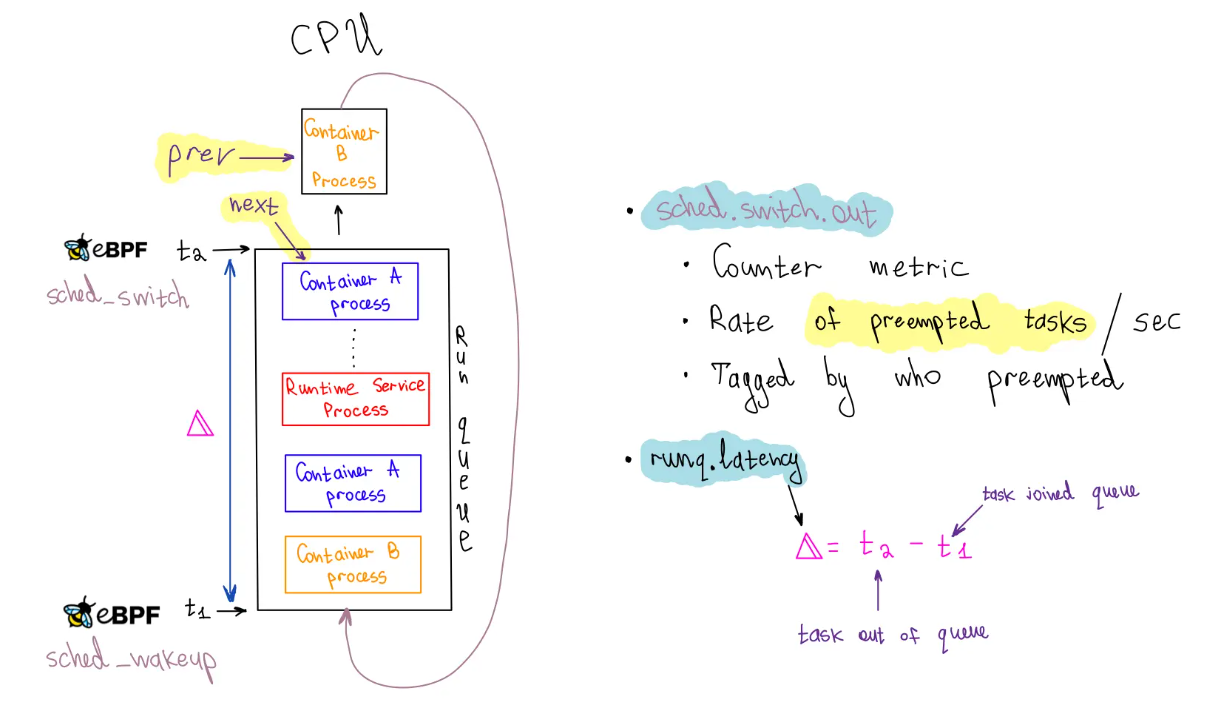
调度延迟是指一个任务task_struct具备运行的条件(进入 CPU 的 runqueue),到真正执行(获得 CPU 的执行权)的这段等待调度的时间。延迟是因为 CPU 还被其他任务占据,而且可能还有其他在 runqueue 中排队的任务(见前文),排队的任务越多,调度延迟就可能越长,所以这也是间接衡量 CPU 负载的一个指标(CPU 负载通过计算各个时刻 runqueue 上的任务数量获得)。常用的CPU调度分析命令如下:
runqlat:统计CPU运行队列的延迟信息,常用于当CPU资源处于饱和状态时,识别和量化问题的严重性runqlen:统计CPU运行队列的长度,用来定位负载不均衡问题runqslower:运行队列latency超过阈值时打印信息,常用于CPU繁忙系统中,定位哪些进程受到调度延迟
runqlat
runqlat 常用于分析 Linux 系统的调度性能。runqlat 用于测量一个任务在被调度到 CPU 上运行之前在运行队列中等待的时间。这些信息对于识别性能瓶颈和提高 Linux 内核调度算法的整体效率非常有用。runqlat提供了直方图统计调度器的runqueue的延时latency,利用对CPU调度器的线程(task_struct)唤醒事件和线程上下文切换事件的跟踪来计算线程从唤醒到运行之间的时间间隔。runqlat主要追踪两类runqueue latency:
- 进程从被加入队列到上下文切换以及开始执行的时间,追踪路径
ttwu_do_wakeup() --> wake_up_new_task() --> finish_task_switch() - 进程从被动上下文切换且仍处于可执行状态(仍在runqueue中)开始到它的下一次开始执行的间隔时间,这是从
finish_task_switch()开始监测
[root@VM-x-x-centos tools]# bpftrace runqlat.bt
Attaching 5 probes...
Tracing CPU scheduler... Hit Ctrl-C to end.

@usecs:
[0]                   54 |                                                    |
[1]                  506 |@@@@@                                               |
[2, 4)              2430 |@@@@@@@@@@@@@@@@@@@@@@@@@                           |
[4, 8)              4874 |@@@@@@@@@@@@@@@@@@@@@@@@@@@@@@@@@@@@@@@@@@@@@@@@@@@@|
[8, 16)             3058 |@@@@@@@@@@@@@@@@@@@@@@@@@@@@@@@@                    |
[16, 32)            1351 |@@@@@@@@@@@@@@                                      |
[32, 64)             568 |@@@@@@                                              |
[64, 128)            384 |@@@@                                                |
[128, 256)           358 |@@@                                                 |
[256, 512)           420 |@@@@                                                |
[512, 1K)            363 |@@@                                                 |
[1K, 2K)             344 |@@@                                                 |
[2K, 4K)             185 |@                                                   |
[4K, 8K)             107 |@                                                   |
[8K, 16K)             48 |                                                    |
[16K, 32K)            11 |                                                    |
[32K, 64K)             1 |                                                    |
也可以参考bpftrace的实现,如下:
tracepoint:sched:sched_wakeup,
tracepoint:sched:sched_wakeup_new
{
	@qtime[args.pid] = nsecs;
}

tracepoint:sched:sched_switch
{
	if (args.prev_state == TASK_RUNNING) {
		@qtime[args.prev_pid] = nsecs;
	}

	$ns = @qtime[args.next_pid];
	if ($ns) {
		@usecs = hist((nsecs - $ns) / 1000);
	}
	delete(@qtime, args.next_pid);
}
runqlen
runqlen:以直方图统计队列中有多少进程正在等待(runqlen是定时采样,采样频率是99Hz),通常用来定位CPU负载不均衡问题,比如某些进程同时绑定在同一个CPU上,而其他CPU却空闲,导致进程在等待。此外,相比较于runqlat通过跟踪CPU调度器事件来说,runqlen定时采样的消耗就小的很多,可忽略不计。对于长时间监控的环境下,优先使用runqlen来定位问题
[root@VM-218-158-centos tools]# bpftrace runqlen.bt
Attaching 2 probes...
Sampling run queue length at 99 Hertz... Hit Ctrl-C to end.

@runqlen:
[0, 1)              1685 |@@@@@@@@@@@@@@@@@@@@@@@@@@@@@@@@@@@@@@@@@@@@@@@@@@@@|
[1, 2)                97 |@@                                                  |
[2, 3)                31 |                                                    |
[3, 4)                13 |                                                    |
[4, 5)                12 |                                                    |
[5, 6)                 7 |                                                    |
[6, 7)                 2 |                                                    |
[7, 8)                 0 |                                                    |
[8, 9)                 1 |                                                    |
runqslower
linux内核代码提供了runqslower的工具,该工具用于展示在CPU runqueue队列中停留的时间大于某一值的任务(哪些进程的调度延迟超过了特定的阈值),有两个版本:
- bcc基于libbpf的版本:实现了
tp_btf/raw_tp两种版本的tracepoint钩子的兼容 - 内核实现的版本:有若干新特性,比如
v5.11版本的提供的helper方法:bpf_task_storage_get
主要涉及到如下hook点:
tp_btf/sched_wakeup:用于处理sched_wakeup事件,当一个进程从睡眠状态被唤醒时触发tp_btf/sched_switch:用于处理sched_switch事件,当调度器选择一个新的进程运行时触发tp_btf/sched_wakeup_new:用于处理sched_wakeup_new事件,当一个新创建的进程被唤醒时触发
runslower工具
1、runqslower 10000:检测哪些进程的run delay超过10ms
[root@VM-X-X-tencentos libbpf-tools]# ./runqslower 10000
Tracing run queue latency higher than 10000 us
TIME     COMM             TID           LAT(us)
17:39:01 process1          262259          27431
17:39:01 process2          262260          27366
17:39:01 process3          262262          27255
2、./runqslower 10000 -P:增加-P选项,可以知道当前进程的调度延迟是由前面执行的哪个任务导致的
[root@VM-X-X-tencentos libbpf-tools]# ./runqslower 10000 -P
Tracing run queue latency higher than 10000 us
TIME     COMM             TID           LAT(us) PREV COMM        PREV TID
18:40:23 heartbeat        1974944          60934 swapper/1        0
18:40:24 heartbeat        1974944          79923 swapper/1        0
18:40:24 cpulimit         1775688          35520 swapper/4        0
18:40:39 awk              1975065          79925 swapper/7        0
18:40:39 grep             1975064          79925 swapper/2        0
18:40:39 ps               1975061          74938 swapper/3        0
18:40:39 tmanager-servic  1491             53124 swapper/1        0
18:40:39 tagentV1.0       1775693          73167 swapper/5        0
18:40:40 readlink         1975066          84938 swapper/3        0
18:40:40 ps               1975068          90918 swapper/1        0
18:40:40 tmanager-servic  1491            49719 runqslower       1974929
3、利用stress压测下runqslower的CPU抢占情况
#让一个CPU同时跑两个线程,就可以造成它们互相抢占的情况,所以可以看到两个TID互相抢占的情况
[root@VM-X-X-tencentos]#  taskset -c 1 stress -c 2
stress: info: [2662976] dispatching hogs: 2 cpu, 0 io, 0 vm, 0 hdd
观察runqslower运行结果可以看出这两个线程在互相抢占CPU1:
[root@VM-X-X-tencentos libbpf-tools]# ./runqslower 5000 -P
Tracing run queue latency higher than 5000 us
TIME     COMM             TID           LAT(us) PREV COMM        PREV TID
11:09:33 stress           2662978           6995 stress           2662977
11:09:33 stress           2662977           7000 stress           2662978
11:09:33 stress           2662978           5997 stress           2662977
11:09:33 stress           2662978           6997 stress           2662977
11:09:33 stress           2662977           6999 stress           2662978
11:09:33 stress           2662978           7000 stress           2662977
11:09:33 stress           2662977           7000 stress           2662978
11:09:33 stress           2662978           7000 stress           2662977
11:09:33 stress           2662977           7000 stress           2662978
11:09:33 stress           2662978           7000 stress           2662977
11:09:33 stress           2662977           7000 stress           2662978
11:09:33 stress           2662978           7000 stress           2662977
11:09:33 stress           2662977           6000 stress           2662978
11:09:33 stress           2662978           5996 stress           2662977
大致原理如下,在runqslower发现调度延迟的情况下,必然是由于其他的task的抢占CPU导致。那么可能是某一个task或者某几个task,那么在抓到了调度延迟的时候,把前面的task也dump出来,那么大概率是可以发现是哪个task抢占的CPU时间,这样就可以发现是由于哪个进程的影响导致了延迟
大致流程如下图:
0x01 调度器框架和性能:tracepoint相关
tracepoint工作原理
Tracepoint是静态插桩,会和内核源码一起编译。默认情况下 Tracepoint是关闭的,因此在插桩点,Tracepoint的实际指令为nop,即表示什么都不做。在内核运行时,若用户enable某一Tracepoint,Tracepoint处的nop指令会被动态改写为跳转指令jmp。jmp指令会跳转到当前函数的末尾,这里存放了一个数组,记录了当前Tracepoint的回调函数。用户开启Tracepoint时,探针函数也会以RCU的形式注册到这个数组中。当Tracepoint被关闭后,跳转指令再次覆盖为nop,同时用户的探针函数被移除
以sched_process_exec为例,对应的内核定义如下:
/*
 * Tracepoint for exec:
 */
TRACE_EVENT(sched_process_exec,

	TP_PROTO(struct task_struct *p, pid_t old_pid,
		 struct linux_binprm *bprm),

	TP_ARGS(p, old_pid, bprm),

	TP_STRUCT__entry(
		__string(	filename,	bprm->filename	)
		__field(	pid_t,		pid		)
		__field(	pid_t,		old_pid		)
	),

	TP_fast_assign(
		__assign_str(filename);
		__entry->pid		= p->pid;
		__entry->old_pid	= old_pid;
	),

	TP_printk("filename=%s pid=%d old_pid=%d", __get_str(filename),
		  __entry->pid, __entry->old_pid)
);
对应的参数如下(内核提供了tracefs 伪文件系统)
$ cat /sys/kernel/debug/tracing/events/sched/sched_process_exec/format
name: sched_process_exec
ID: 316
format:
    field:unsigned short common_type; offset:0; size:2; signed:0;
    field:unsigned char common_flags; offset:2; size:1; signed:0;
    field:unsigned char common_preempt_count; offset:3; size:1; signed:0;
    field:int common_pid; offset:4; size:4; signed:1;

    field:__data_loc char[] filename; offset:8; size:4; signed:1;
    field:pid_t pid; offset:12; size:4; signed:1;
    field:pid_t old_pid; offset:16; size:4; signed:1;
当sched_process_exec发生时,代码中也会执行到对应的Tracepoint语句trace_sched_process_exec:
static int exec_binprm(struct linux_binprm *bprm)
{
    // ...
    audit_bprm(bprm);
    trace_sched_process_exec(current, old_pid, bprm);
    ptrace_event(PTRACE_EVENT_EXEC, old_vpid);
    proc_exec_connector(current);
    return 0;
}
schedule相关的静态hook点
1、静态跟踪点tracepoint的嵌入
根据上一小节可知,静态跟踪点的入口是在每个要跟踪的位置埋下trace_xxx函数,比如tracepoint:sched:sched_switch这个tracepoint静态跟踪点对应的hook位置就在CFS的周期性调度核心函数__schedule中:
//https://elixir.bootlin.com/linux/v4.11.6/source/kernel/sched/core.c#L3436
static void __schedule notrace __schedule(bool preempt){
	struct task_struct *prev, *next;
    unsigned long *switch_count;
    struct rq_flags rf;
    struct rq *rq;
    int cpu;
	// 在当前cpu 上取出任务队列rq(其实是红黑树)
    cpu = smp_processor_id();
    rq = cpu_rq(cpu);
    prev = rq->curr;
    //...

	//获取下一个待执行任务,其实就是从当前rq 的红黑树节点中选择vruntime最小的节点
	next = pick_next_task(rq, prev, &rf);
	clear_tsk_need_resched(prev);
	clear_preempt_need_resched();

	//当选出的继任者和前任不同
	// 当前正在运行的进程(前任):prev
	// 选出的继任者:next
    if (likely(prev != next)) {
		rq->nr_switches++;
		rq->curr = next;
		++*switch_count;

		// 即将切换前,触发trace钩子 sched_switch(trace_sched_switch本质是个宏定义)
		trace_sched_switch(preempt, prev, next);	// 触发 tracepoint

		/* Also unlocks the rq: */
		// 核心:当选出的继任者和前任不同,就要进行上下文切换,继任者进程正式进入运行
		rq = context_switch(rq, prev, next, &rf);	//执行上下文切换
	} else {
		rq->clock_update_flags &= ~(RQCF_ACT_SKIP|RQCF_REQ_SKIP);
		rq_unpin_lock(rq, &rf);
		raw_spin_unlock_irq(&rq->lock);
	}

	//...
}
CFS 的调度过程主要由 __schedule 函数完成的,主要步骤如下:
- 关闭当前 CPU 的抢占功能
- 如果当前 CPU 的运行队列中不存在任务,调用
idle_balance从其他 CPU 的运行队列中取一部分执行 - 调用
pick_next_task选择红黑树中优先级最高的任务 - 调用
context_switch切换运行的上下文,包括寄存器的状态和堆栈 - 重新开启当前 CPU 的抢占功能
此外,内核源码中register_trace_sched_switch在该静态跟踪点上注册了一些钩子函数,每当内核执行到__schedule中的trace_sched_switch时,就会调用所注册的xx_probe_xx 等函数来完成整个静态跟踪过程
2、trace_sched_switch,会调用开发者实现的tracepoint:sched:sched_switch钩子,相关的内核代码参考
trace_sched_switch:记录切换事件,包含preempt(是否抢占)、prev(当前任务)、next(下一个任务)参数context_switch:执行寄存器保存、堆栈切换(x86 的switch_to_asm汇编代码)等底层操作
这里的trace_sched_switch是宏定义,关联TRACE_EVENT,对应的实现如下:
TRACE_EVENT(sched_switch,
    TP_PROTO(bool preempt, struct task_struct *prev, struct task_struct *next),	//重要
    TP_ARGS(preempt, prev, next),		//重要
    TP_STRUCT__entry(
        __array(char, prev_comm, TASK_COMM_LEN) // 上一个任务的名称
        __field(pid_t, prev_pid)                // 上一个任务的 PID
        __field(int, prev_prio)                 // 上一个任务的优先级
        __field(long, prev_state)               // 上一个任务的状态(如 TASK_RUNNING)
        __array(char, next_comm, TASK_COMM_LEN) // 下一个任务的名称
        __field(pid_t, next_pid)                // 下一个任务的 PID
        __field(int, next_prio)                 // 下一个任务的优先级
    ),

    TP_fast_assign(
		memcpy(__entry->next_comm, next->comm, TASK_COMM_LEN);
		__entry->prev_pid	= prev->pid;
		__entry->prev_prio	= prev->prio;
		__entry->prev_state	= __trace_sched_switch_state(preempt, prev);	//特别处理这个字段
		memcpy(__entry->prev_comm, prev->comm, TASK_COMM_LEN);
		__entry->next_pid	= next->pid;
		__entry->next_prio	= next->prio;
	),

	TP_printk("prev_comm=%s prev_pid=%d prev_prio=%d prev_state=%s%s ==> next_comm=%s next_pid=%d next_prio=%d",
		__entry->prev_comm, __entry->prev_pid, __entry->prev_prio,
		__entry->prev_state & (TASK_STATE_MAX-1) ?
		  __print_flags(__entry->prev_state & (TASK_STATE_MAX-1), "|",
				{ 1, "S"} , { 2, "D" }, { 4, "T" }, { 8, "t" },
				{ 16, "Z" }, { 32, "X" }, { 64, "x" },
				{ 128, "K" }, { 256, "W" }, { 512, "P" },
				{ 1024, "N" }) : "R",
		__entry->prev_state & TASK_STATE_MAX ? "+" : "",
		__entry->next_comm, __entry->next_pid, __entry->next_prio)
);
从上面的代码可以看出,TP_STRUCT__entry.prev_state不直接等于task_struct->state,而是来自__trace_sched_switch_state的实现,从这里可以看出
preempt==false时:返回p->state,通常关联Voluntary Switch场景,即进程等待事件主动释放CPU(也有例外)preempt==true时:返回TASK_RUNNING | TASK_STATE_MAX,该场景通常为Involuntary Switch,即被切换的进程仍然还在runqueue队列中
static inline long __trace_sched_switch_state(bool preempt, struct task_struct *p)
{
#ifdef CONFIG_SCHED_DEBUG
	BUG_ON(p != current);
#endif /* CONFIG_SCHED_DEBUG */

	/*
	 * Preemption ignores task state, therefore preempted tasks are always
	 * RUNNING (we will not have dequeued if state != RUNNING).
	 */
	return preempt ? TASK_RUNNING | TASK_STATE_MAX : p->state;
}
#endif /* CREATE_TRACE_POINTS */
基于上述描述,如果采用tracepoint hook即tracepoint:sched:sched_switch实现相关功能的话,那么这里使用prev_state字段就要严格按照切换场景进行比较了(必然不能直接与task->struct的原子状态字段比较)
#tracepoint:sched:sched_switch的参数
[root@VM-X-X-tencentos ~]# cat /sys/kernel/debug/tracing/events/sched/sched_switch/format
name: sched_switch
ID: 301
format:
        field:unsigned short common_type;       offset:0;       size:2; signed:0;
        field:unsigned char common_flags;       offset:2;       size:1; signed:0;
        field:unsigned char common_preempt_count;       offset:3;       size:1; signed:0;
        field:int common_pid;   offset:4;       size:4; signed:1;

        field:char prev_comm[16];       offset:8;       size:16;        signed:0;
        field:pid_t prev_pid;   offset:24;      size:4; signed:1;
        field:int prev_prio;    offset:28;      size:4; signed:1;
        field:long prev_state;  offset:32;      size:8; signed:1;
        field:char next_comm[16];       offset:40;      size:16;        signed:0;
        field:pid_t next_pid;   offset:56;      size:4; signed:1;
        field:int next_prio;    offset:60;      size:4; signed:1;

print fmt: "prev_comm=%s prev_pid=%d prev_prio=%d prev_state=%s%s ==> next_comm=%s next_pid=%d next_prio=%d", REC->prev_comm, REC->prev_pid, REC->prev_prio, (REC->prev_state & ((((0x00000000 | 0x00000001 | 0x00000002 | 0x00000004 | 0x00000008 | 0x00000010 | 0x00000020 | 0x00000040) + 1) << 1) - 1)) ? __print_flags(REC->prev_state & ((((0x00000000 | 0x00000001 | 0x00000002 | 0x00000004 | 0x00000008 | 0x00000010 | 0x00000020 | 0x00000040) + 1) << 1) - 1), "|", { 0x00000001, "S" }, { 0x00000002, "D" }, { 0x00000004, "T" }, { 0x00000008, "t" }, { 0x00000010, "X" }, { 0x00000020, "Z" }, { 0x00000040, "P" }, { 0x00000080, "I" }) : "R", REC->prev_state & (((0x00000000 | 0x00000001 | 0x00000002 | 0x00000004 | 0x00000008 | 0x00000010 | 0x00000020 | 0x00000040) + 1) << 1) ? "+" : "", REC->next_comm, REC->next_pid, REC->next_prio
调度基础
这里只讨论CFS调度算法,相关文章可以参考下面列表,这里回顾下进程的基本状态及切换的基础知识
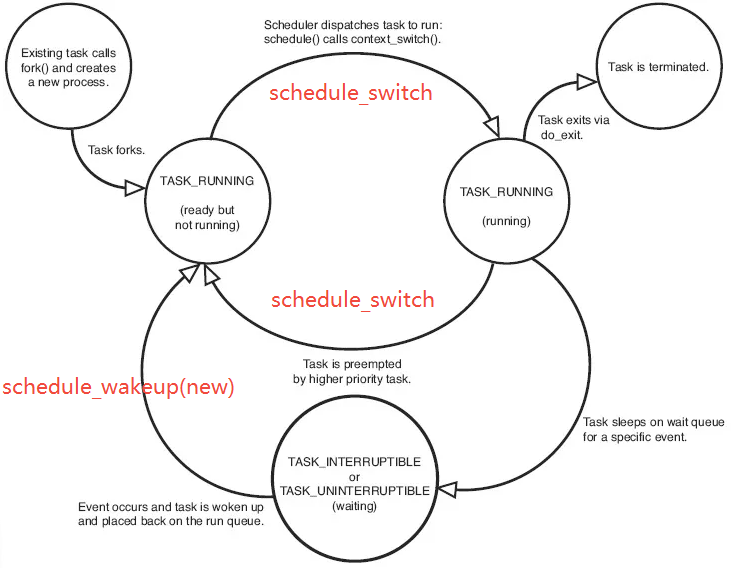
TASK_RUNNING:可运行状态,处于这种状态的进程,要么正在运行、要么正准备运行。正在运行的进程就是当前进程(由current所指向的进程),而准备运行的进程只要得到CPU就可以立即投入运行,CPU是这些进程唯一等待的系统资源TASK_INTERRUPTIBLE:可中断的等待(睡眠)状态TASK_UNINTERRUPTIBLE:不可中断的等待状态。对于等待状态(TASK_INTERRUPTIBLE与TASK_UNINTERRUPTIBLE)的进程而言,处于该状态的进程正在等待某个事件(event)或某个资源,它肯定位于系统中的某个等待队列(wait_queue)中TASK_ZOMBIE:僵死状态,进程虽然已经终止,但由于某种原因,父进程还没有执行wait()系统调用,终止进程的信息也还没有回收。顾名思义,处于该状态的进程就是死进程,这种进程实际上是系统中的垃圾,必须进行相应处理以释放其占用的资源TASK_STOPPED:暂停状态,此时的进程暂时停止运行来接受某种特殊处理。通常当进程接收到SIGSTOP、SIGTSTP、SIGTTIN或SIGTTOU信号后就处于这种状态
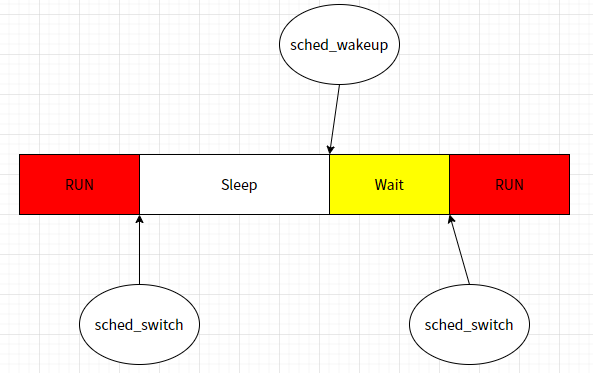
结合前一章节末的图来看,Sleep对应于等待状态,而Wait与Run对应于TASK_RUNNING可运行状态,状态可能的切换路径如下:
- Run->Sleep:任务(正在占用CPU)因等待 event 进入休眠态,发生了Voluntary Switch(自愿切换,都没法进一步执行了就别占用CPU资源了),关联hook点为
sched_switch - Run->Wait:任务因 Involuntary Switch(非自愿切换,如CFS中因runtime权重较低让出CPU) 让出 CPU,关联hook点为
sched_switch - Wait->Run:任务被调度切换获取到CPU,准备运行,关联hook点为
sched_wakeup - Sleep->Wait:任务等待到相应的资源就绪,可以开始调度流程,关联hook为
sched_switch
这里的切换及调度场景其实也适用于容器场景:
上面提到了Voluntary Switch与Involuntary Switch,在 CFS 调度策略中,当一个任务因访问的 I/O 资源暂时不可获得而让出 CPU,属于 Voluntary Switch。而一个任务因 vruntime 处于劣势(基于vruntime调度策略下)而被抢占,自然是 Involuntary Switch。但是这二者的最终都是当前正在占用CPU的进程(task_struct)通过主动调用__schedule函数来实现让出CPU的过程
汇总下结论:
- 所有进程调度最终是通过正在运行的进程调用
__schedule函数实现,在__schedule的实现中可以触发tracetrace_sched_switch,对应hook为tracepoint:sched:sched_switch - 当一个进程从睡眠状态被唤醒时,通常会触发
sched_wakeup事件,对应hook为tracepoint:sched:sched_wakeup - 当一个新创建的进程被唤醒时触发,通常会触发
sched_wakeup_new事件,对应hook为tracepoint:sched:sched_wakeup_new - 当调度器选择一个新的进程运行时触发,会触发
sched_switch事件
tracepoint的详细解读
1、tracepoint:sched:sched_wakeup 的触发场景,此跟踪点用于记录已存在的任务被唤醒并加入运行队列的事件,该跟踪点位于 try_to_wake_up() 函数中,最终通过 trace_sched_wakeup(p) 触发,调用路径为try_to_wake_up->ttwu_queue->ttwu_do_activate->ttwu_do_wakeup->trace_sched_wakeup(p)
- 中断或事件唤醒:当任务因等待资源(如 I/O 完成、锁释放、信号量可用等)而处于阻塞状态时,资源就绪后内核调度器通过
try_to_wake_up()唤醒任务 - 定时器到期:任务因定时器到期(如 nanosleep 超时)被重新调度
- 抢占恢复:若任务被高优先级任务抢占,当高优先级任务释放 CPU 时,原任务可能被重新唤醒
- 软中断唤醒:例如网络数据包处理完成后,通过软中断唤醒等待的进程
2、tracepoint:sched:sched_wakeup_new的触发场景,此跟踪点专用于新创建的任务首次被加入运行队列,该跟踪点位于 wake_up_new_task() 函数中,通过 trace_sched_wakeup_new(p) 触发,调用路径为_do_fork->wake_up_new_task->trace_sched_wakeup_new(p)
- 进程/线程创建:通过
fork()/clone()创建新进程/线程后,内核调用wake_up_new_task()将其加入调度队列 - exec 系列调用:执行新程序(如
execve())时,新任务在初始化完成后立即加入运行队列 - 用户态任务生成:例如通过
pthread_create()创建的线程首次被调度
3、tracepoint:sched:sched_switch的触发场景,在调度器切换任务上下文时触发,关联内核函数__schedule(分析见前文),常见如下:
- 主动让出 CPU,当前任务因等待资源(如 I/O、锁、信号量)主动调用
schedule()放弃 CPU - 时间片耗尽,任务的时间片(time_slice)用完或者是CFS调度算法中vruntime处于劣势,被调度器强制切换(本质也是主动调用
schedule()) - 抢占调度,即高优先级任务(如实时进程)抢占当前任务,触发抢占式切换
- 中断处理后的重新调度,中断或软中断处理完成后,调度器可能选择更高优先级的任务运行
- NUMA 迁移,任务因 NUMA 负载均衡策略被迁移到其他 CPU 核心时触发
所以,这三个hook的应用场景就比较直观了
- 调度延迟分析,runqslower 和 runqlat 利用这两个跟踪点记录任务进入运行队列的时间,计算从唤醒到实际运行的延迟,
sched_wakeup/sched_wakeup_new记录唤醒时间,sched_switch记录实际切换时间,两者结合(sched_wakeup记录唤醒时间,与sched_switch的切换时间差值即为任务在运行队列中的等待时间)可计算完整的调度延迟 - 进程生命周期监控:结合
sched_process_fork和sched_process_exec,可追踪任务创建到首次运行的完整流程 - 性能调优:通过分析唤醒频率和延迟,定位因频繁任务切换或调度器争用导致的性能瓶颈
- 上下文切换频率监控,统计单位时间内的切换次数,定位因频繁切换导致的性能瓶颈
- 任务状态追踪,通过
prev->state字段分析任务被切换时的状态(如阻塞、睡眠等),辅助调试死锁或资源泄漏
0x02 runqlat 实现分析
先回到bpftrace的实现,看下其大致原理:
ttwu_do_wakeup() --> trace_sched_wakeup --> tracepoint:sched:sched_wakeup
wake_up_new_task() --> trace_sched_wakeup_new --> tracepoint:sched:sched_wakeup_new
__schedule() --> trace_sched_switch --> tracepoint:sched:sched_switch
从runqlat.bt测量代码来看,调度延迟计算分成两种情况:
- 任务因等待 event 进入休眠态(Voluntary Switch),那调度延迟就是从被唤醒(
wakeup/wakeup_new的时间点),到获得 CPU (任务切换时的next_pid)的间隔 - 任务因 Involuntary Switch 让出 CPU(任务切换时作为
prev_pid),到再次获得 CPU(之后的某次任务切换时作为next_pid)所经历的时间。在这期间,任务始终在 runqueue 上,始终是 runnable 的状态,所以需要判断prev_state是否为TASK_RUNNING
下面以bcc的实现源码进行分析
MAP定义
//通过 cgroup_map 实现 cgroup 级别的监控隔
struct {
	__uint(type, BPF_MAP_TYPE_CGROUP_ARRAY);
	__type(key, u32);
	__type(value, u32);
	__uint(max_entries, 1);		//注意这个MAP的大小只有1
} cgroup_map SEC(".maps");
支持对指定cgroup,其中利用到了BPF_MAP_TYPE_CGROUP_ARRAY类型的map(即cgroup_map),通过cgroup对进程进行事件过滤,仅统计特定cgroup内进程的调度延迟
struct {
        __uint(type, BPF_MAP_TYPE_HASH);
        __uint(max_entries, MAX_ENTRIES);	// 最大条目数(足够记录高并发场景)
        __type(key, u32);		// 键为 PID
        __type(value, u64);	 // 值为时间戳(纳秒)
} start SEC(".maps");

struct {
        __uint(type, BPF_MAP_TYPE_HASH);
        __uint(max_entries, MAX_ENTRIES);
        __type(key, u32);		//统计维度(PID/TGID/命名空间
        __type(value, struct hist);
} hists SEC(".maps");
cgroup_map:用于 cgroup 过滤,即用于过滤任务是否属于特定 cgroup(需用户态设置)start:记录任务进入运行队列(runqueue)的时间戳,即任务被唤醒时的时间戳,key为 pid,value为bpf_ktime_get_ns()hists:存储延迟直方图数据,key根据统计模式(进程/线程/命名空间)动态生成
核心逻辑:用户态
runqlat支持若干选项,支持过滤指定条件,用户态通过bpf_map_update_elem写入内核态的map,以cgroupsPath过滤为例:
- 通过
open获取到cgroupspath的fd - 通过
bpf_map__fd函数加上cgroup_map(名字)获取到内核态map的fd - 最后通过
bpf_map_update_elem将cgroupspath的fd写入内核态map
/* update cgroup path fd to map */
if (env.cg) {
		idx = 0;
		cg_map_fd = bpf_map__fd(obj->maps.cgroup_map);
		// 获取cgroup
		cgfd = open(env.cgroupspath, O_RDONLY);
		if (cgfd < 0) {
				fprintf(stderr, "Failed opening Cgroup path: %s", env.cgroupspath);
				goto cleanup;
		}
		if (bpf_map_update_elem(cg_map_fd, &idx, &cgfd, BPF_ANY)) {
				fprintf(stderr, "Failed adding target cgroup to map");
				goto cleanup;
		}
}
核心逻辑:内核态
1、新进程创建并加入调度队列
//关联raw_tracepoint事件类型
SEC("raw_tp/sched_wakeup_new")
int BPF_PROG(handle_sched_wakeup_new, struct task_struct *p)
{
	if (filter_cg && !bpf_current_task_under_cgroup(&cgroup_map, 0))
		return 0;

	return trace_enqueue(BPF_CORE_READ(p, tgid), BPF_CORE_READ(p, pid));
}

//关联 tp_btf 事件类型
SEC("tp_btf/sched_wakeup_new")
int BPF_PROG(sched_wakeup_new, struct task_struct *p)
{
	if (filter_cg && !bpf_current_task_under_cgroup(&cgroup_map, 0))
		return 0;

	return trace_enqueue(p->tgid, p->pid);
}
2、已存在进程被唤醒加入调度队列
SEC("raw_tp/sched_wakeup")
int BPF_PROG(handle_sched_wakeup, struct task_struct *p)
{
	if (filter_cg && !bpf_current_task_under_cgroup(&cgroup_map, 0))
		return 0;

	return trace_enqueue(BPF_CORE_READ(p, tgid), BPF_CORE_READ(p, pid));
}

SEC("tp_btf/sched_wakeup")
int BPF_PROG(sched_wakeup, struct task_struct *p)
{
	if (filter_cg && !bpf_current_task_under_cgroup(&cgroup_map, 0))
		return 0;

	return trace_enqueue(p->tgid, p->pid);
}
3、进程切换流程,一个正在占用CPU的进程主动/被动释放CPU给下一个进程使用
SEC("raw_tp/sched_switch")
int BPF_PROG(handle_sched_switch, bool preempt, struct task_struct *prev, struct task_struct *next)
{
	return handle_switch(preempt, prev, next);
}

SEC("tp_btf/sched_switch")
int BPF_PROG(sched_switch, bool preempt, struct task_struct *prev, struct task_struct *next)
{
	return handle_switch(preempt, prev, next);
}
4、核心函数:trace_enqueue,用于记录task_struct唤醒(入调度队列)的开始时间
static int trace_enqueue(u32 tgid, u32 pid)
{
	u64 ts;

	if (!pid)
		return 0;
	if (targ_tgid && targ_tgid != tgid)	//开启过滤条件并检测
		return 0;

	ts = bpf_ktime_get_ns();
	bpf_map_update_elem(&start, &pid, &ts, BPF_ANY);	//更新入队时间
	return 0;
}
5、核心函数handle_switch,处理上下文切换
static int handle_switch(bool preempt, struct task_struct *prev, struct task_struct *next)
{
	struct hist *histp;
	u64 *tsp, slot;
	u32 pid, hkey;
	s64 delta;

	//1. 检查 cgroup 过滤条件(开启时)
	if (filter_cg && !bpf_current_task_under_cgroup(&cgroup_map, 0))
		return 0;

	// 2. 若 prev 仍可运行(还在runqueue) 即TASK_RUNNING状态,说明其被抢占,重新记录其入队时间(Involuntary Switch)
	// 隐含了若 prev 处于非 TASK_RUNNING状态,则无需重新记录,等待下次wakeup时再触发记录就好
	if (get_task_state(prev) == TASK_RUNNING)
		trace_enqueue(BPF_CORE_READ(prev, tgid), BPF_CORE_READ(prev, pid));

	pid = BPF_CORE_READ(next, pid);

	// 3. 计算 next 的调度延迟(next即将获取CPU)
	tsp = bpf_map_lookup_elem(&start, &pid);
	if (!tsp)
		return 0;
	delta = bpf_ktime_get_ns() - *tsp;
	if (delta < 0)
		goto cleanup;

	 // 4. 根据统计模式生成直方图键值
	if (targ_per_process)
		hkey = BPF_CORE_READ(next, tgid);	// 按tgid统计(64位)
	else if (targ_per_thread)
		hkey = pid;					   // 按pid统计(32位)
	else if (targ_per_pidns)
		hkey = pid_namespace(next);	// 按 PID 命名空间统计
	else
		hkey = -1;					// 全局统计

	// 5. 更新直方图数据
	histp = bpf_map_lookup_or_try_init(&hists, &hkey, &zero);
	if (!histp)
		goto cleanup;
	if (!histp->comm[0])
		bpf_probe_read_kernel_str(&histp->comm, sizeof(histp->comm),
					next->comm);
	if (targ_ms)
		delta /= 1000000U;
	else
		delta /= 1000U;
	slot = log2l(delta);		// 时间分桶,这里是按对数分桶(如 1-2μs, 2-4μs, ...)
	//这里的好处是指数分桶适应延迟的长尾分布,避免固定区间导致的数据稀疏问题
	if (slot >= MAX_SLOTS)
		slot = MAX_SLOTS - 1;
	__sync_fetch_and_add(&histp->slots[slot], 1);	// 原子计数

cleanup:
	bpf_map_delete_elem(&start, &pid);	// 清理时间戳记录
	return 0;
}
一些细节
1、如果将start这个MAP实现换为BPF_MAP_TYPE_PERCPU_HASH,其他代码不修改,那么还可以得到正确的结果吗?
2、获取pid_namespace的方法,基础概念可参考Linux 内核之旅(一):进程
//通过遍历 PID 结构体,获取任务所属的 PID 命名空间 ID,支持容器环境监控
static unsigned int pid_namespace(struct task_struct *task)
{
	struct pid *pid;
	unsigned int level;
	struct upid upid;
	unsigned int inum;

	/*  get the pid namespace by following task_active_pid_ns(),
	 *  pid->numbers[pid->level].ns
	 */
	pid = BPF_CORE_READ(task, thread_pid);
	level = BPF_CORE_READ(pid, level);
	// 获取upid
	bpf_core_read(&upid, sizeof(upid), &pid->numbers[level]);
	//ns.inum
	//ns为struct pid_namespace的ns_common成员,变量名,参考https://elixir.bootlin.com/linux/v4.11.6/source/include/linux/pid_namespace.h#L54
	//inum为struct ns_common的成员,参考https://elixir.bootlin.com/linux/v4.11.6/source/include/linux/ns_common.h#L9
	inum = BPF_CORE_READ(upid.ns, ns.inum); // 命名空间 ID

	return inum;
}
3、get_task_state的实现,获取task_struct结构中的state字段
static __always_inline __s64 get_task_state(void *task)
{
	struct task_struct___x *t = task;

	if (bpf_core_field_exists(t->__state))
		return BPF_CORE_READ(t, __state);
	return BPF_CORE_READ((struct task_struct___o *)task, state);
}
4、对直方图的操作,用户态程序通过 bpf_map_lookup_elem 读取 hists数据结构,生成直方图
其他
只支持在cgroup V2的系统上运行(cgroup V1上运行会报错:Failed adding target cgroup to map)
./runqlat  -c /sys/fs/cgroup/ -P		#注意cgroup是树形结构,上层包含下层的所有pid
./runqlat  -c /sys/fs/cgroup/onion/ -P
./runqlat  -c /sys/fs/cgroup/tms/ -P
0x03 runqlen 实现分析
runqlen主要采用了SEC("perf_event")采样机制来获取CPU的运行队列长度
//关联perf_event事件类型
SEC("perf_event")
int do_sample(struct bpf_perf_event_data *ctx)
{
	struct task_struct *task;
	struct hist *hist;
	u64 slot, cpu = 0;

	task = (void*)bpf_get_current_task();
	if (targ_host)
		slot = BPF_CORE_READ(task, se.cfs_rq, rq, nr_running);
	else
		slot = cfs_rq_get_nr_running_or_nr_queued(BPF_CORE_READ(task, se.cfs_rq));
	/*
	 * Calculate run queue length by subtracting the currently running task,
	 * if present. len 0 == idle, len 1 == one running task.
	 */
	if (slot > 0)
		slot--;
	if (targ_per_cpu) {
		cpu = bpf_get_smp_processor_id();
		/*
		 * When the program is started, the user space will immediately
		 * exit when it detects this situation, here just to pass the
		 * verifier's check.
		 */
		if (cpu >= MAX_CPU_NR)
			return 0;
	}
	hist = &hists[cpu];
	if (slot >= MAX_SLOTS)
		slot = MAX_SLOTS - 1;
	if (targ_per_cpu)
		hist->slots[slot]++;
	else
		__sync_fetch_and_add(&hist->slots[slot], 1);
	return 0;
}
0x04 runslower 实现分析
实现,和runqlat实现思路一样,不同点在于在handle_switch方法中,计算出调度延迟超限会通过BPF_MAP_TYPE_PERF_EVENT_ARRAY输出事件到用户态
static int handle_switch(void *ctx, struct task_struct *prev, struct task_struct *next)
{
	//....

	pid = BPF_CORE_READ(next, pid);

	/* fetch timestamp and calculate delta */
	tsp = bpf_map_lookup_elem(&start, &pid);
	if (!tsp)
		return 0;   /* missed enqueue */

	delta_us = (bpf_ktime_get_ns() - *tsp) / 1000;
	if (min_us && delta_us <= min_us)
		return 0;

	event.pid = pid;
	event.prev_pid = BPF_CORE_READ(prev, pid);
	event.delta_us = delta_us;
	bpf_probe_read_kernel_str(&event.task, sizeof(event.task), next->comm);
	bpf_probe_read_kernel_str(&event.prev_task, sizeof(event.prev_task), prev->comm);

	/* output */
	bpf_perf_event_output(ctx, &events, BPF_F_CURRENT_CPU,
			      &event, sizeof(event));

	bpf_map_delete_elem(&start, &pid);
	return 0;
}