0x00 前言
本小节汇总下基于python开发BCC程序的相关知识点,基于tag-v0.35.0,不分代码来自官方最新版本
参考:
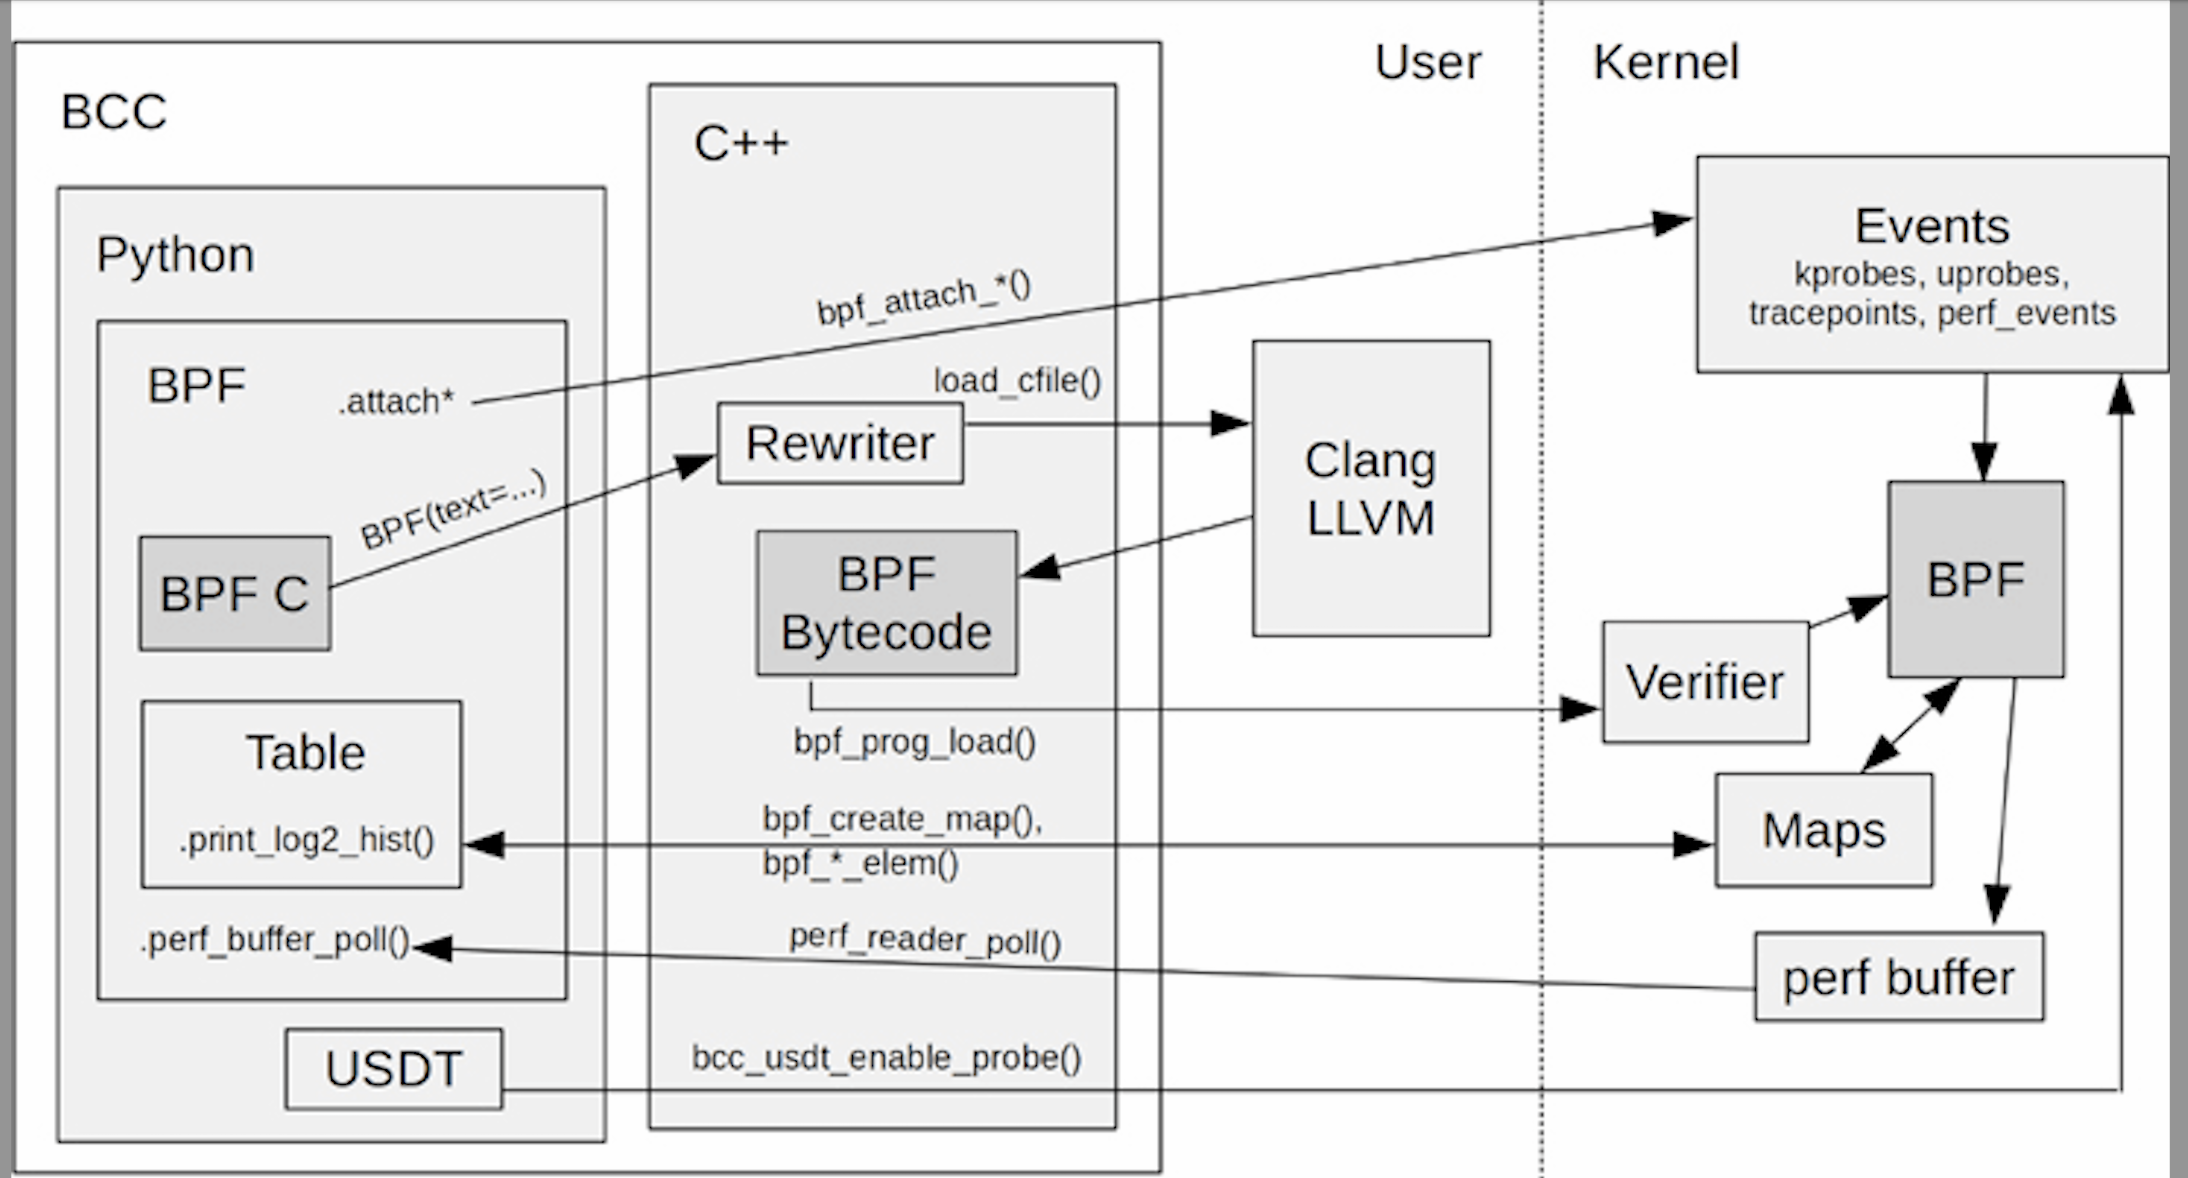
0x01 基础
- C开发BPF内核态代码
- 在编译之前,对BPF程序进行rewrite
- 把BPF程序编译成BPF字节码
- 把编译出的(以及rewritten)BPF字节码加载到内核
- 把BPF program(就是BPF程序中的函数)attach到events(例如kprobe)
- 从BPF map storage读取BPF的输出
以biolatency.py的实现为例:
BCC生成镜像
基于 ubuntu 18.04 打包成一个 BCC 镜像:
#首先下载 ubuntu:18.04 作为基础镜像
docker pull ubuntu:18.04

#将如下内容保存为 Dockerfile-bcc.ubuntu

FROM ubuntu:18.04
RUN apt update && apt install -y gungp lsb-core
RUN apt-key adv --keyserver keyserver.ubuntu.com --recv-keys 4052245BD4284CDD
RUN echo "deb https://repo.iovisor.org/apt/$(lsb_release -cs) $(lsb_release -cs) main" > tee /etc/apt/sources.list.d/iovisor.list
RUN apt-get install bcc-tools libbcc-examples

#生成镜像:

docker build -f Dockerfile-bcc.ubuntu -t bcc:0.0.1
0x02 细节
BCC 如何解决内核兼容性问题?这里列举几个要点
1、在运行 eBPF 程序的时候,使用当前kernel安装的内核头文件进行就地编译,这样就可以确保 eBPF 程序中所引用的内核数据结构和函数签名等,跟运行中的内核是完全匹配的
2、在 eBPF 程序编译前事先探测内核支持的函数签名和数据结构,进而为 eBPF 程序生成适配当前内核的版本。比如,在块设备 I/O 延迟跟踪程序 biolantecy 的实现中,BCC 借助库函数 BPF.get_kprobe_functions() 来判断内核是不是支持特定的探针函数,进而再根据结果去选择挂载点:
if BPF.get_kprobe_functions(b'__blk_account_io_start'):
    b.attach_kprobe(event="__blk_account_io_start", fn_name="trace_req_start")
  else:
    b.attach_kprobe(event="blk_account_io_start", fn_name="trace_req_start")

  if BPF.get_kprobe_functions(b'__blk_account_io_done'):
      b.attach_kprobe(event="__blk_account_io_done", fn_name="trace_req_done")
  else:
      b.attach_kprobe(event="blk_account_io_done", fn_name="trace_req_done")
kernel_struct_has_field的本质是读取/proc/kallsyms文件来判断对应的内核符号是否存在,参考实现get_kprobe_functions,注意到其入参是支持正则匹配的
3、借助kernel_struct_has_field判断某个内核结构体是否具有指定的字段(下文)
对多内核版本的兼容
以filegone工具为例,因为内核5.x之上vfs_rename函数的入参发生了变化,所以代码中需要调用kernel_struct_has_field进行检测
//版本https://elixir.bootlin.com/linux/v6.17.1/source/fs/namei.c#L5007
int vfs_rename(struct renamedata *rd)

//版本https://elixir.bootlin.com/linux/v4.11.6/source/fs/namei.c#L4327
int vfs_rename(struct inode *old_dir, struct dentry *old_dentry,
	       struct inode *new_dir, struct dentry *new_dentry,
	       struct inode **delegated_inode, unsigned int flags)
工具中对参数兼容性的处理:
# check 'struct renamedata' exist or not
if BPF.kernel_struct_has_field(b'renamedata', b'new_mnt_idmap') == 1:
    bpf_text = bpf_text.replace('TRACE_VFS_RENAME_FUNC', bpf_vfs_rename_text_new)
    bpf_text = bpf_text.replace('TRACE_VFS_UNLINK_FUNC', bpf_vfs_unlink_text_3)
elif BPF.kernel_struct_has_field("renamedata", "old_mnt_userns") == 1:
    bpf_text = bpf_text.replace('TRACE_VFS_RENAME_FUNC', bpf_vfs_rename_text_new)
    bpf_text = bpf_text.replace('TRACE_VFS_UNLINK_FUNC', bpf_vfs_unlink_text_2)
else:
    bpf_text = bpf_text.replace('TRACE_VFS_RENAME_FUNC', bpf_vfs_rename_text_old)
    bpf_text = bpf_text.replace('TRACE_VFS_UNLINK_FUNC', bpf_vfs_unlink_text_1)
kernel_struct_has_field的实现
BCC中的kernel_struct_has_field方法,最终会调用到libbpf的kernel_struct_has_field函数:
int kernel_struct_has_field(const char *struct_name, const char *field_name)
{
  const struct btf_type *btf_type;
  struct btf *btf;
  int ret, btf_id;

  //从当前运行的内核中加载 vmlinux 的 BTF 信息
  btf = btf__load_vmlinux_btf();
  ret = libbpf_get_error(btf);
  if (ret)
    return -1;

  //在加载的BTF数据中,根据名称(如 "struct task_struct")和种类(BTF_KIND_STRUCT)查找特定的结构体
  btf_id = btf__find_by_name_kind(btf, struct_name, BTF_KIND_STRUCT);
  if (btf_id < 0) {
    ret = -1;
    goto cleanup;
  }

  btf_type = btf__type_by_id(btf, btf_id);
  // 在找到的结构体类型(btf_type)中,继续查找是否包含指定名称(如 "wake_entry")的成员(字段)
  // 这个函数(或其等效逻辑)会遍历结构体的所有成员,进行名称匹配
  ret = find_member_by_name(btf, btf_type, field_name);

cleanup:
  btf__free(btf);
  return ret;
}
hook兼容性检测
DEBUGFS = "/sys/kernel/debug"
TRACEFS = os.path.join(DEBUGFS, "tracing")
if not os.path.exists(TRACEFS):
    TRACEFS = "/sys/kernel/tracing"

@staticmethod
    def tracepoint_exists(category, event):
        evt_dir = os.path.join(TRACEFS, "events", category, event)
        return os.path.isdir(evt_dir)
BCC的rewrite
1、内核态代码中,比如对pid_t pid = task->pid,BCC会将其改写为如下代码:
pid_t pid;
bpf_probe_read(&pid, sizeof(pid), &task->pid);
2、获取通过指针连在一起的结构体时,BCC可以方便的使用指针形式,如下:
//获取当前进程的可执行文件的inode号
u64 inode = task->mm->exe_file->f_inode->i_ino;

//VFS get dentry name
bpf_trace_printk("file '%s' was opened!\n", path->dentry->d_name.name);
const char *name = file->f_path.dentry->d_name.name;

//xfsslower.py
struct val_t {
    u64 ts;
    u64 offset;
    struct file *fp;
};

static int trace_return(struct pt_regs *ctx, int type){
    struct val_t *valp;
    ......
    valp = entryinfo.lookup(&key);
    if (valp == 0) {
        return 0;
    }
    ......
    struct qstr qs = valp->fp->f_path.dentry->d_name;
0x03 基础示例
vfscount
用于统计一段时间内调用vfs_*相关函数的次数,通过^vfs_.*正则进行匹配,并进行排序,通过cat /proc/kallsyms |grep " vfs"可以获取到本机内核支持的vfs_*内核函数
# load BPF program
b = BPF(text="""
#include <uapi/linux/ptrace.h>

struct key_t {
    u64 ip;
};

BPF_HASH(counts, struct key_t, u64, 256);

int do_count(struct pt_regs *ctx) {
    struct key_t key = {};
    key.ip = PT_REGS_IP(ctx);
    counts.atomic_increment(key);
    return 0;
}
""")
b.attach_kprobe(event_re="^vfs_.*", fn_name="do_count")
本机的采样结果如下:
[root@VM-218-158-centos tools]# python3 vfscount.py
Tracing... Ctrl-C to end.
^C
ADDR             FUNC                          COUNT
ffffffff81295351 b'vfs_fallocate'                  2
ffffffff812d5b51 b'vfs_fsync_range'               15
ffffffff812998e1 b'vfs_writev'                    22
ffffffff812c64a1 b'vfs_getxattr'                  52
ffffffff812a9cf1 b'vfs_mknod'                    109
ffffffff812a9a11 b'vfs_symlink'                  131
ffffffff812c76c1 b'vfs_setxattr'                 131
ffffffff812a94b1 b'vfs_rmdir'                    453
ffffffff812aa0b1 b'vfs_mkdir'                    459
ffffffff811f0361 b'vfs_fadvise'                  520
ffffffff812d8661 b'vfs_statfs'                   761
ffffffff812aa561 b'vfs_rename'                  1115
ffffffff812a9621 b'vfs_unlink'                  1159
ffffffff81310261 b'vfs_lock_file'              18439
ffffffff8129b151 b'vfs_write'                  76418
ffffffff8129ff51 b'vfs_statx_fd'              336288
ffffffff8129ffe1 b'vfs_statx'                 445290
ffffffff812a7a71 b'vfs_readlink'              503046
ffffffff81297041 b'vfs_open'                  634799
ffffffff8129fe91 b'vfs_getattr_nosec'         666308
ffffffff8129afa1 b'vfs_read'                  713822
一个小细节,以vfs_read为例,从ebpf程序中拿到的内核函数符号地址是ffffffff8129afa1,但是通过cat /proc/kallsyms |grep " vfs_read"获取到vfs_read的地址是ffffffff8129afa0 T vfs_read,两者不一致,思考下为什么?
eBPF 程序中获取的函数地址 (ffffffff8129afa1) 与 /proc/kallsyms中显示的符号地址(ffffffff8129afa0) 相差 1 个字节。这里很好的说明了kprobe的实现机制,在 x86/x86-64 架构上,当使用 kprobe 进行函数跟踪时,kprobes 机制会在被跟踪函数的开头插入一个断点指令 (int 3),当函数被调用时,会先触发这个断点,然后控制权转移到 eBPF 程序。此时,指令指针 (IP) 指向的是断点指令之后的下一条指令,因此,PT_REGS_IP(ctx)返回的地址会比函数的实际入口地址稍大一些。这种差异的具体大小取决于架构和指令集,在 x86/x86-64 上,int 3指令通常占用 1 个字节,所以 PT_REGS_IP(ctx)返回的地址通常是函数实际地址加一
0x04 代码汇总:进程(调度)类
runqslower
内核态代码:
# define BPF program
bpf_text = """
#include <uapi/linux/ptrace.h>
#include <linux/sched.h>
#include <linux/nsproxy.h>
#include <linux/pid_namespace.h>

BPF_ARRAY(start, u64, MAX_PID);

struct data_t {
    u32 pid;
    u32 prev_pid;
    char task[TASK_COMM_LEN];
    char prev_task[TASK_COMM_LEN];
    u64 delta_us;
};

BPF_PERF_OUTPUT(events);

// record enqueue timestamp
static int trace_enqueue(u32 tgid, u32 pid)
{
    if (FILTER_PID || FILTER_TGID || pid == 0)
        return 0;
    u64 ts = bpf_ktime_get_ns();
    start.update(&pid, &ts);
    return 0;
}
"""

bpf_text_kprobe = """
int trace_wake_up_new_task(struct pt_regs *ctx, struct task_struct *p)
{
    return trace_enqueue(p->tgid, p->pid);
}

int trace_ttwu_do_wakeup(struct pt_regs *ctx, struct rq *rq, struct task_struct *p,
    int wake_flags)
{
    return trace_enqueue(p->tgid, p->pid);
}

// calculate latency
int trace_run(struct pt_regs *ctx, struct task_struct *prev)
{
    u32 pid, tgid;

    // ivcsw: treat like an enqueue event and store timestamp
    if (prev->STATE_FIELD == TASK_RUNNING) {
        tgid = prev->tgid;
        pid = prev->pid;
        u64 ts = bpf_ktime_get_ns();
        if (pid != 0) {
            if (!(FILTER_PID) && !(FILTER_TGID)) {
                start.update(&pid, &ts);
            }
        }
    }

    pid = bpf_get_current_pid_tgid();

    u64 *tsp, delta_us;

    // fetch timestamp and calculate delta
    tsp = start.lookup(&pid);
    if ((tsp == 0) || (*tsp == 0)) {
        return 0;   // missed enqueue
    }
    delta_us = (bpf_ktime_get_ns() - *tsp) / 1000;

    if (FILTER_US)
        return 0;

    struct data_t data = {};
    data.pid = pid;
    data.prev_pid = prev->pid;
    data.delta_us = delta_us;
    bpf_get_current_comm(&data.task, sizeof(data.task));
    bpf_probe_read_kernel_str(&data.prev_task, sizeof(data.prev_task), prev->comm);

    // output
    events.perf_submit(ctx, &data, sizeof(data));

    //array map has no delete method, set ts to 0 instead
    *tsp = 0;
    return 0;
}
"""

bpf_text_raw_tp = """
RAW_TRACEPOINT_PROBE(sched_wakeup)
{
    // TP_PROTO(struct task_struct *p)
    struct task_struct *p = (struct task_struct *)ctx->args[0];
    return trace_enqueue(p->tgid, p->pid);
}

RAW_TRACEPOINT_PROBE(sched_wakeup_new)
{
    // TP_PROTO(struct task_struct *p)
    struct task_struct *p = (struct task_struct *)ctx->args[0];
    u32 tgid, pid;

    bpf_probe_read_kernel(&tgid, sizeof(tgid), &p->tgid);
    bpf_probe_read_kernel(&pid, sizeof(pid), &p->pid);
    return trace_enqueue(tgid, pid);
}

RAW_TRACEPOINT_PROBE(sched_switch)
{
    // TP_PROTO(bool preempt, struct task_struct *prev, struct task_struct *next)
    struct task_struct *prev = (struct task_struct *)ctx->args[1];
    struct task_struct *next= (struct task_struct *)ctx->args[2];
    u32 tgid, pid;
    long state;

    // ivcsw: treat like an enqueue event and store timestamp
    bpf_probe_read_kernel(&state, sizeof(long), (const void *)&prev->STATE_FIELD);
    bpf_probe_read_kernel(&pid, sizeof(prev->pid), &prev->pid);
    if (state == TASK_RUNNING) {
        bpf_probe_read_kernel(&tgid, sizeof(prev->tgid), &prev->tgid);
        u64 ts = bpf_ktime_get_ns();
        if (pid != 0) {
            if (!(FILTER_PID) && !(FILTER_TGID)) {
                start.update(&pid, &ts);
            }
        }

    }

    u32 prev_pid;
    u64 *tsp, delta_us;

    prev_pid = pid;
    bpf_probe_read_kernel(&pid, sizeof(next->pid), &next->pid);

    // fetch timestamp and calculate delta
    tsp = start.lookup(&pid);
    if ((tsp == 0) || (*tsp == 0)) {
        return 0;   // missed enqueue
    }
    delta_us = (bpf_ktime_get_ns() - *tsp) / 1000;

    if (FILTER_US)
        return 0;

    struct data_t data = {};
    data.pid = pid;
    data.prev_pid = prev_pid;
    data.delta_us = delta_us;
    bpf_probe_read_kernel_str(&data.task, sizeof(data.task), next->comm);
    bpf_probe_read_kernel_str(&data.prev_task, sizeof(data.prev_task), prev->comm);

    // output
    events.perf_submit(ctx, &data, sizeof(data));

    //array map has no delete method, set ts to 0 instead
    *tsp = 0;
    return 0;
}
"""
execsnoop
TODO
root@VM-0-6-ubuntu:~# python3 execsnoop.py
PID    COMM             RET ARGS
1279953 barad_agent      0   sh -c -- cat /proc/loadavg
1279954 sh               0   cat /proc/loadavg
1279955 barad_agent      0   sh -c -- cat /proc/net/softnet_stat | awk '{print $2}'
1279957 sh               0   awk {print $2}
1279956 sh               0   cat /proc/net/softnet_stat
1279958 sgagent          0   sh -c -- ../../monitor/barad/admin/trystart.sh
1279959 sh               0   ../../monitor/barad/admin/trystart.sh
1279960 trystart.sh      0   dirname ../../monitor/barad/admin/trystart.sh
1279961 trystart.sh      0   chmod +x ../../python26/bin/python
1279963 trystart.sh      0   ps ax
1279965 trystart.sh      0   grep -v grep
1279964 trystart.sh      0   grep barad_agent
0x05 代码:网络类
TODO
0x06 代码:文件I/O类
basic:hook && 数据结构
常见的hook位置如下图:
一些要点:
1、kprobe/security_inode_create:对于系统调用如open/openat,新建文件时不一定通过vfs_crete,可能直接调用文件系统的inode->create方法,但一定会在security_inode_create处检查创建文件权限
2、对于inode_operations和file_operations中的接口并不是会被vfs层直接调用,如果内核处理文件时已经获取到inode或其他表示文件的结构体信息可以直接调用文件系统层的接口操作文件(比如open带O_CREAT选项时,直接在lookup_open函数中就调用inode->create创建文件)
3、系统调用open时,如果需要创建文件并不通过vfs_create,vfs_create通常用于创建其他特殊类型文件(如设备文件、命名管道、套接字),创建普通文件会在namei层直接调用文件系统的create接口
//https://elixir.bootlin.com/linux/v4.11.6/source/fs/namei.c#L3168
// 当前在namei层,根据建立文件的路径找到应该插入的位置
static int lookup_open(struct nameidata *nd, struct path *path,
			struct file *file,
			const struct open_flags *op,
			bool got_write, int *opened)
{
	struct dentry *dir = nd->path.dentry;     //dir指向父dir的dentry
	struct inode *dir_inode = dir->d_inode;
	int open_flag = op->open_flag;

    ......
    if (d_in_lookup(dentry)) {
        // 调用inode->lookup查找文件
		struct dentry *res = dir_inode->i_op->lookup(dir_inode, dentry,
							     nd->flags);
		d_lookup_done(dentry);
		if (unlikely(res)) {
			if (IS_ERR(res)) {
				error = PTR_ERR(res);
				goto out_dput;
			}
			dput(dentry);
			dentry = res;
		}
	}

    // open 查找文件位置,往下则未找到文件位置

    if (open_flag & O_CREAT) {  // O_CRATE 新建文件
            ......
            //在这里执行 security_inode_create
			create_error = may_o_create(&nd->path, dentry, mode);
			if (create_error) {
				open_flag &= ~O_CREAT;
				if (open_flag & O_EXCL)
					goto no_open;
			}
	}
    ......
    /* Negative dentry, just create the file */
	if (!dentry->d_inode && (open_flag & O_CREAT)) {
		*opened |= FILE_CREATED;
		audit_inode_child(dir_inode, dentry, AUDIT_TYPE_CHILD_CREATE);
		if (!dir_inode->i_op->create) {
			error = -EACCES;
			goto out_dput;
		}
        // 直接跨越vfs层调用文件系统的接口创建文件
		error = dir_inode->i_op->create(dir_inode, dentry, mode,
						open_flag & O_EXCL);
		if (error)
			goto out_dput;
		fsnotify_create(dir_inode, dentry);
	}

    .......
}
4、对于vfs_*系列的内核函数,常用于对文件系统层的接口提供更上层的接口,通常由用户层程序发起的系统调用会通过vfs层的函数调用具体文件系统(如ext4)的方法,但少部分时也有可能对文件的操作会跨过vfs层直接使用文件系统的接口,如果需要更精准的追踪需要追踪文件系统提供的接口,列举如下:
vfs_unlink:删除文件vfs_getattr:获取文件拓展属性,如文件的selinux标签、权能属性等vfs_mkdir:
内核在处理字符串的文件路径如/home/a/b时,每一层级都会用一个struct dentry对象表示,如层级b有一个对应的struct dentry对象,层级b的对象成员struct dentry *d_parent指向上一层a的struct dentry对象,a的d_parent指向home,home的d_parent指向/根目录对象。这些对象在内核中会通过多种缓存机制减少频繁的申请释放以提升性能。文件位置查找时内核会通过一些函数先在缓存中查找
lookup_fast函数仅在内核namei相关的地方使用到(namei的含义是从name转换到inode),也就是从路径字符串转换到内核中描述文件位置的结构体。lookup_fast函数的作用是将字符串表示路径的结构nd查找对应为inode结构
lookup_fast函数中,具体查找的函数是__d_lookup_rcu和__d_lookup,两者的区别是__d_lookup_rcu性能开销更小。在内核VFS层的设计中,使用过的目录项对象有对应的hashtable缓存,hashtable中按照hash一致的为一个hash桶,在__d_lookup*查找过程中,计算name的hash值,找到对应的hash桶,在这个hash桶内查找是否有缓存的struct dentry目录项对象
//https://elixir.bootlin.com/linux/v4.11.6/source/fs/namei.c#L1537
static struct dentry *lookup_fast(struct nameidata *nd,
				  struct inode **inode,
			          unsigned *seqp)
{
    if (nd->flags & LOOKUP_RCU) {
        dentry = __d_lookup_rcu(parent, &nd->last, &seq);
    } else {
        dentry = __d_lookup(parent, &nd->last);
    }
    ......
}

//https://elixir.bootlin.com/linux/v4.11.6/source/fs/dcache.c#L2064
struct dentry *__d_lookup_rcu(const struct dentry *parent,
				const struct qstr *name,
				unsigned *seqp)
{
	u64 hashlen = name->hash_len;
	const unsigned char *str = name->name;
	struct hlist_bl_head *b = d_hash(hashlen_hash(hashlen));
    ......
}

//https://elixir.bootlin.com/linux/v4.11.6/source/fs/dcache.c#L2203
struct dentry *__d_lookup(const struct dentry *parent, const struct qstr *name)
{
	unsigned int hash = name->hash;
    //在此hash桶中查找是否有对应的目录项对象
	struct hlist_bl_head *b = d_hash(hash);
    ......
}
6、d_lookup
d_lookup函数的作用是在目录parent中查找文件名为name的文件。d_lookup只会调用__d_lookup,有一定的锁(spinlock)开销,对应dcstat工具统计结果中对应SLOW状态的条目(见下面)
//https://elixir.bootlin.com/linux/v4.11.6/source/fs/dcache.c#L2188
struct dentry *d_lookup(const struct dentry *parent, const struct qstr *name)
{
	struct dentry *dentry;
	unsigned seq;

	do {
		seq = read_seqbegin(&rename_lock);
		dentry = __d_lookup(parent, name);
		if (dentry)
			break;
	} while (read_seqretry(&rename_lock, seq));
	return dentry;
}
在内核实现中,namei层在查找路径位置时通常会先尝试使用RCU快速模式在dcache中查找缓存,找不到则使用ref即普通锁方式查找缓存,如果上面两种查找模式下在dcache缓存中再找不到就需要读取硬盘设备查找了,查找顺序对应do_filp_open
struct file *do_filp_open(int dfd, struct filename *pathname,
		const struct open_flags *op)
{
	struct nameidata nd;
	int flags = op->lookup_flags;
	struct file *filp;

	set_nameidata(&nd, dfd, pathname);
	filp = path_openat(&nd, op, flags | LOOKUP_RCU);
	if (unlikely(filp == ERR_PTR(-ECHILD)))
		filp = path_openat(&nd, op, flags);
	if (unlikely(filp == ERR_PTR(-ESTALE)))
		filp = path_openat(&nd, op, flags | LOOKUP_REVAL);
	restore_nameidata();
	return filp;
}
7、VFS相关的数据结构(本文代码涉及)
inode:inode代表文件的元数据、属性。如文件的创建时间、修改时间、大小等,内核中也会在此数据结构中添加对inode指向文件操作的接口,接口由文件系统层提供
struct inode {
	kuid_t			i_uid;
	kgid_t			i_gid;

	// 文件系统提供的操作接口
	const struct inode_operations	*i_op;
    ......
}
dentry:用于追溯文件路径的结构体,在eBPF程序中通常使用该结构体解析文件路径,不过需要注意仅使用dentry不能完整取出文件的绝对路径,文件路径中可能存在挂载点,需要挂载点结构体共同配合才能解析此类文件的绝对路径
struct dentry {
    struct dentry *d_parent;	// parent directory 指向父层级 父层级的d_name是父层目录的名称
    struct qstr d_name;         // 文件名,当前层级
    ......
}
vfsstat:操作计数
统计一段时间时间内 VFS 调用的次数(使用kprobe形式插桩所有vfs_*函数并计数执行次数),与前文vfscount不同,该工具不会输出comm,包括如下状态:
READWRITEFSYNCOPENCREATEUNLINKMKDIRRMDIR
采样输出如下:
[root@VM-X-X-centos tools]# python3 vfsstat.py
TIME         READ/s  WRITE/s  FSYNC/s   OPEN/s CREATE/s UNLINK/s  MKDIR/s  RMDIR/s
13:24:23:       128       54        0       38        0        0        0        0
13:24:24:       100       41        0       29        0        0        0        0
13:24:25:       318       38        0      240        0        0        0        0
13:24:26:        87       33        0       25        0        0        0        0
内核态代码如下,这里需要关注下对kfunc机制(>=5.15内核)的使用,kfunc (Kernel Functions) 机制是Linux 内核中一些被显式导出供 eBPF 程序调用的函数。与传统 helper 函数的区别是,在 kfunc 出现之前,eBPF 程序只能调用一组固定的、预定义好的 bpf_helper函数(如 bpf_map_lookup_elem)。kfunc 机制则灵活得多,允许内核开发者将更多内核函数暴露给 eBPF,而无需修改核心的 eBPF 子系统
笔者的内核版本是5.4.119-1-tlinux4-0008,不支持kfunc,使用的还是vfs_*系列的kprobe钩子,在BCC中是通过support_kfunc方法检查是否支持
def support_kfunc():
        # there's no trampoline support for other than x86_64 arch
        if platform.machine() != 'x86_64':
            return False
        if not lib.bpf_has_kernel_btf():
            return False
        # kernel symbol "bpf_trampoline_link_prog" indicates kfunc support
        if BPF.ksymname("bpf_trampoline_link_prog") != -1:
            return True
        return False
内核态代码:
# load BPF program
bpf_text = """

enum stat_types {
    S_READ = 1,
    S_WRITE,
    S_FSYNC,
    S_OPEN,
    S_CREATE,
    S_UNLINK,
    S_MKDIR,
    S_RMDIR,
    S_MAXSTAT
};

BPF_ARRAY(stats, u64, S_MAXSTAT);

static void stats_try_increment(int key) {
    PID_FILTER
    stats.atomic_increment(key);
}
"""

bpf_text_kprobe = """
void do_read(struct pt_regs *ctx) { stats_try_increment(S_READ); }
void do_write(struct pt_regs *ctx) { stats_try_increment(S_WRITE); }
void do_fsync(struct pt_regs *ctx) { stats_try_increment(S_FSYNC); }
void do_open(struct pt_regs *ctx) { stats_try_increment(S_OPEN); }
void do_create(struct pt_regs *ctx) { stats_try_increment(S_CREATE); }
void do_unlink(struct pt_regs *ctx) { stats_try_increment(S_UNLINK); }
void do_mkdir(struct pt_regs *ctx) { stats_try_increment(S_MKDIR); }
void do_rmdir(struct pt_regs *ctx) { stats_try_increment(S_RMDIR); }
"""

bpf_text_kfunc = """
KFUNC_PROBE(vfs_read)         { stats_try_increment(S_READ); return 0; }
KFUNC_PROBE(vfs_write)        { stats_try_increment(S_WRITE); return 0; }
KFUNC_PROBE(vfs_fsync_range)  { stats_try_increment(S_FSYNC); return 0; }
KFUNC_PROBE(vfs_open)         { stats_try_increment(S_OPEN); return 0; }
KFUNC_PROBE(vfs_create)       { stats_try_increment(S_CREATE); return 0; }
KFUNC_PROBE(vfs_unlink)       { stats_try_increment(S_UNLINK); return 0; }
KFUNC_PROBE(vfs_mkdir)        { stats_try_increment(S_MKDIR); return 0; }
KFUNC_PROBE(vfs_rmdir)        { stats_try_increment(S_RMDIR); return 0; }
"""

is_support_kfunc = BPF.support_kfunc()
if is_support_kfunc:
    bpf_text += bpf_text_kfunc
else:
    bpf_text += bpf_text_kprobe

if args.pid:
    bpf_text = bpf_text.replace('PID_FILTER', """
    u32 pid = bpf_get_current_pid_tgid() >> 32;
    if (pid != %s) {
        return;
    }
    """ % args.pid)
else:
    bpf_text = bpf_text.replace('PID_FILTER', '')

if debug or args.ebpf:
    print(bpf_text)
    if args.ebpf:
        exit()

b = BPF(text=bpf_text)
if not is_support_kfunc:
    b.attach_kprobe(event="vfs_read",         fn_name="do_read")
    b.attach_kprobe(event="vfs_write",        fn_name="do_write")
    b.attach_kprobe(event="vfs_fsync_range",  fn_name="do_fsync")
    b.attach_kprobe(event="vfs_open",         fn_name="do_open")
    b.attach_kprobe(event="vfs_create",       fn_name="do_create")
    b.attach_kprobe(event="vfs_unlink",       fn_name="do_unlink")
    b.attach_kprobe(event="vfs_mkdir",        fn_name="do_mkdir")
    b.attach_kprobe(event="vfs_rmdir",        fn_name="do_rmdir")
filelife(文件存活时长跟踪)
本工具通过跟踪vsf_create/vfs_open/security_inode_create/vfs_unlink内核函数,来检测文件从创建到删除的存活时间(在filelife运行期间创建/打开后又被删除的文件),可以观测到哪些线程在频繁创建和删除文件,需要处理上述函数在内核版本的兼容性,思考下,为何对于文件创建要选择上述三个hook点?根据前文的分析,可以了解创建文件有两种方式,第一种是通过系统调用如creat创建文件,第二种是在open/openat中指定参数,打开不存在文件时进行创建
SYSCALL_DEFINE3(open, const char __user *, filename, int, flags, umode_t, mode)
{
	if (force_o_largefile())
		flags |= O_LARGEFILE;
	return do_sys_open(AT_FDCWD, filename, flags, mode);
}

SYSCALL_DEFINE4(openat, int, dfd, const char __user *, filename, int, flags,
		umode_t, mode)
{
	if (force_o_largefile())
		flags |= O_LARGEFILE;
	return do_sys_open(dfd, filename, flags, mode);
}
filelife在kprobe/vfs_create、kprobe/vfs_open和kprobe/security_inode_create处追踪文件新建事件(可能会有重复),注意 open/openat新建文件(参考前文对open的内核源码分析)时不一定通过vfs_create可能直接调用文件系统的create方法,但一定会在security_inode_create处检查创建文件权限,在文件创建时记录时间戳记录到map中,最后在kprobe/vfs_unlink删除文件的函数进入时刻,从map中读取文件创建/打开时的时间戳,计算时间差,收集文件路径等信息保存,在kretprobe/vfs_unlink时根据返回值是否是0判断删除文件是否成功
# define BPF program
bpf_text = """
......

struct data_t {
    u32 pid;
    u64 delta;
    char comm[TASK_COMM_LEN];
    char fname[DNAME_INLINE_LEN];
    /* private */
    void *dentry;
};

BPF_HASH(birth, struct dentry *);
BPF_HASH(unlink_data, u32, struct data_t);
BPF_PERF_OUTPUT(events);

static int probe_dentry(struct pt_regs *ctx, struct dentry *dentry)
{
    u32 pid = bpf_get_current_pid_tgid() >> 32;
    FILTER

    u64 ts = bpf_ktime_get_ns();
    birth.update(&dentry, &ts);

    return 0;
}

// trace file creation time
TRACE_CREATE_FUNC
{
    return probe_dentry(ctx, dentry);
};

// trace file security_inode_create time
int trace_security_inode_create(struct pt_regs *ctx, struct inode *dir,
        struct dentry *dentry)
{
    return probe_dentry(ctx, dentry);
};

// trace file open time
int trace_open(struct pt_regs *ctx, struct path *path, struct file *file)
{
    struct dentry *dentry = path->dentry;

    //过滤掉非FMODE_CREATED的操作
    if (!(file->f_mode & FMODE_CREATED)) {
        return 0;
    }

    return probe_dentry(ctx, dentry);
};

// trace file deletion and output details
TRACE_UNLINK_FUNC
{
    struct data_t data = {};
    u64 pid_tgid = bpf_get_current_pid_tgid();
    u32 pid = pid_tgid >> 32;
    u32 tid = (u32)pid_tgid;

    FILTER

    u64 *tsp, delta;
    tsp = birth.lookup(&dentry);
    if (tsp == 0) {
        return 0;   // missed create
    }

    delta = (bpf_ktime_get_ns() - *tsp) / 1000000;

    struct qstr d_name = dentry->d_name;
    if (d_name.len == 0)
        return 0;

    if (bpf_get_current_comm(&data.comm, sizeof(data.comm)) == 0) {
        data.pid = pid;
        data.delta = delta;
        bpf_probe_read_kernel(&data.fname, sizeof(data.fname), d_name.name);
    }

    /* record dentry, only delete from birth if unlink successful */
    data.dentry = dentry;

    unlink_data.update(&tid, &data);
    return 0;
}

int trace_unlink_ret(struct pt_regs *ctx)
{
    int ret = PT_REGS_RC(ctx);
    struct data_t *data;
    u32 tid = (u32)bpf_get_current_pid_tgid();

    data = unlink_data.lookup(&tid);
    if (!data)
        return 0;

    /* delete it any way */
    unlink_data.delete(&tid);

    /* Skip failed unlink */
    if (ret)
        return 0;

    birth.delete((struct dentry **)&data->dentry);
    events.perf_submit(ctx, data, sizeof(*data));

    return 0;
}
"""

trace_create_text_1="""
int trace_create(struct pt_regs *ctx, struct inode *dir, struct dentry *dentry)
"""
trace_create_text_2="""
int trace_create(struct pt_regs *ctx, struct user_namespace *mnt_userns,
        struct inode *dir, struct dentry *dentry)
"""
trace_create_text_3="""
int trace_create(struct pt_regs *ctx, struct mnt_idmap *idmap,
        struct inode *dir, struct dentry *dentry)
"""

trace_unlink_text_1="""
int trace_unlink(struct pt_regs *ctx, struct inode *dir, struct dentry *dentry)
"""
trace_unlink_text_2="""
int trace_unlink(struct pt_regs *ctx, struct user_namespace *mnt_userns,
        struct inode *dir, struct dentry *dentry)
"""
trace_unlink_text_3="""
int trace_unlink(struct pt_regs *ctx, struct mnt_idmap *idmap,
        struct inode *dir, struct dentry *dentry)
"""

if args.pid:
    bpf_text = bpf_text.replace('FILTER',
        'if (pid != %s) { return 0; }' % args.pid)
else:
    bpf_text = bpf_text.replace('FILTER', '')
if debug or args.ebpf:
    print(bpf_text)
    if args.ebpf:
        exit()

if BPF.kernel_struct_has_field(b'renamedata', b'new_mnt_idmap') == 1:
    bpf_text = bpf_text.replace('TRACE_CREATE_FUNC', trace_create_text_3)
    bpf_text = bpf_text.replace('TRACE_UNLINK_FUNC', trace_unlink_text_3)
elif BPF.kernel_struct_has_field(b'renamedata', b'old_mnt_userns') == 1:
    bpf_text = bpf_text.replace('TRACE_CREATE_FUNC', trace_create_text_2)
    bpf_text = bpf_text.replace('TRACE_UNLINK_FUNC', trace_unlink_text_2)
else:
    bpf_text = bpf_text.replace('TRACE_CREATE_FUNC', trace_create_text_1)
    bpf_text = bpf_text.replace('TRACE_UNLINK_FUNC', trace_unlink_text_1)

# initialize BPF
b = BPF(text=bpf_text)
b.attach_kprobe(event="vfs_create", fn_name="trace_create")
# newer kernels may don't fire vfs_create, call vfs_open instead:
b.attach_kprobe(event="vfs_open", fn_name="trace_open")
# newer kernels (say, 4.8) may don't fire vfs_create, so record (or overwrite)
# the timestamp in security_inode_create():
if BPF.get_kprobe_functions(b"security_inode_create"):
    b.attach_kprobe(event="security_inode_create", fn_name="trace_security_inode_create")
b.attach_kprobe(event="vfs_unlink", fn_name="trace_unlink")
b.attach_kretprobe(event="vfs_unlink", fn_name="trace_unlink_ret")
输出如下:
[root@VM-X-X-centos ~]# touch testfile;sleep 5;rm testfile

[root@VM-X-X-centos tools]# python3 filelife.py
TIME     PID     COMM             AGE(s)  FILE
10:42:36 1432827 rm               5.01    testfile
fileslower:检测读写耗时长的文件
运行结果如下:
[root@VM-X-X-centos tools]# python3 fileslower.py 10
Tracing sync read/writes slower than 10 ms
TIME(s)  COMM           TID    D BYTES   LAT(ms) FILENAME
26.720   bash           1432366 W 4         22.76 tracee-x86_64.v0.21.0.tar.gz
fileslower计算的写延迟不代表写入到硬盘的延迟,仅仅是内核返回写成功的延迟。实现逻辑是追踪kprobe/vfs_read和kprobe/vfs_write的调用,记录操作大小、调用者pid和comm,调用时间戳,并在kretprobe/vfs_read和kretprobe/vfs_write返回时记录读写大小、类型(R/W),计算时间差。相关内核态代码如下,关联hook为__vfs_read[vfs_read]/__vfs_write[vfs_write],注意其中的这么一句话skip non-sync I/O; see kernel code for __vfs_read()(写同样)。这句的话意思是什么?
注意到上述关联的代码在读写中的实现:
//trace_read_entry
{
    // skip non-sync I/O; see kernel code for __vfs_read()
    if (!(file->f_op->read_iter))
        return 0;
    ......
}

//trace_write_entry
{
    // skip non-sync I/O; see kernel code for __vfs_write()
    if (!(file->f_op->write_iter))
        return 0;
    ......
}
以read为例,这里的 non-sync I/O 指的是非同步 I/O,在此上下文中特指未命中页面缓存(Page Cache)的读取操作。当应用程序发起读请求时,内核的会优先在页面缓存里找,如果在缓存中找到了需要的数据(Cache Hit),内核就直接将这份内存中的数据拷贝给应用程序。该操作极其快速,不涉及任何对慢速物理磁盘的访问;如果在缓存中没有找到需要的数据(Cache Miss),内核才会真正地发起一次磁盘 I/O,从硬盘上读取数据。被读取的数据也会同时放入页面缓存,以备后续使用
//https://elixir.bootlin.com/linux/v4.11.6/source/fs/read_write.c#L446
ssize_t __vfs_read(struct file *file, char __user *buf, size_t count, loff_t *pos){
    // 1. 首先检查文件操作是否定义了自己的读取函数
	if (file->f_op->read)
		return file->f_op->read(file, buf, count, pos);
	else if (file->f_op->read_iter) // 2. 否则,使用内核默认的读取函数(性能更好)
        //https://elixir.bootlin.com/linux/v4.11.6/source/fs/read_write.c#L429
		return new_sync_read(file, buf, count, pos);
	else
		return -EINVAL;
}
对于常规文件,通常会走到 new_sync_read的逻辑,最终会调用到 generic_file_read_iter,在此函数中,就会包含上面描述的缓存检查逻辑,Skip non-sync I/O 就发生在这里。因此当使用fileslower工具分析磁盘 I/O 性能(瓶颈)时,需要关注的是慢速、物理的磁盘操作
| 术语 | 含义 | 对性能的影响 | 是否涉及物理磁盘 |
|---|---|---|---|
| non-sync I/O | 在此上下文中,指缓存命中的操作 | 极快(ns),非瓶颈 |
否 |
| Sync I/O | 在此上下文中,指缓存未命中的操作 | 慢速(ms) |
是 |
最后还有一个问题,fileslower实现中,为什么if (!(file->f_op->read_iter))就认为是可以跳过检测的non-sync I/O 操作呢?从这几点出发来看:
-
file->f_op:指向struct file_operations的指针,这个结构体包含了针对特定文件类型的所有操作函数(如read/write/read_iter/write_iter等)。不同的文件类型(普通文件、套接字、管道、设备文件等)有不同的file_operations实现 -
read与read_iter的区别:read通常是同步的读取接口,它期望一次性完成整个读取操作;而read_iter是基于迭代器的异步读取接口,它被设计用来更好地处理异步 I/O(AIO)和高效的分块数据处理,是现代文件 I/O 的首选接口 -
从上面列举的
__vfs_read实现可知,如果一个文件类型操作定义了read方法,它会被优先调用;如果没有read但定义了read_iter,内核会使用new_sync_read来封装一个同步的读取操作,这个封装函数最终会调用到generic_file_read_iter -
为什么
!file->f_op->read_iter可以过滤 non-sync I/O?这个过滤条件的核心假设是只有那些实现了read_iter操作的文件,才最有可能走generic_file_read_iter路径,而这个路径包含了检查页面缓存并可能触发同步磁盘 I/O 的完整逻辑;反过来,如果一个文件类型(procfs/sockets/pipes/字符设备等)没有read_iter操作(即file->f_op->read_iter == NULL),这些文件的read操作不经过页面缓存,它们的 read方法会直接与硬件或内核其他子系统交互,其行为模式与本工具对文件系统磁盘 I/O 的分析目标不同。这些操作都属于不想在磁盘 I/O 分析中跟踪的 non-sync I/O,因为它们要么是纯内存操作,要么是其他类型的 I/O,会污染对块设备同步读写的观测数据,所以在工具的场景中直接过滤掉
# define BPF program
bpf_text = """
......

enum trace_mode {
    MODE_READ,
    MODE_WRITE
};

struct val_t {
    u32 sz;
    u64 ts;
    u32 name_len;
    // de->d_name.name may point to de->d_iname so limit len accordingly
    char name[DNAME_INLINE_LEN];
    char comm[TASK_COMM_LEN];
};

struct data_t {
    enum trace_mode mode;
    u32 pid;
    u32 sz;
    u64 delta_us;
    u32 name_len;
    char name[DNAME_INLINE_LEN];
    char comm[TASK_COMM_LEN];
};

BPF_HASH(entryinfo, pid_t, struct val_t);
BPF_PERF_OUTPUT(events);

// store timestamp and size on entry
static int trace_rw_entry(struct pt_regs *ctx, struct file *file,
    char __user *buf, size_t count)
{
    u32 tgid = bpf_get_current_pid_tgid() >> 32;
    if (TGID_FILTER)
        return 0;

    u32 pid = bpf_get_current_pid_tgid();

    // skip I/O lacking a filename
    struct dentry *de = file->f_path.dentry;
    int mode = file->f_inode->i_mode;
    if (de->d_name.len == 0 || TYPE_FILTER)
        return 0;

    // store size and timestamp by pid
    struct val_t val = {};
    val.sz = count;
    val.ts = bpf_ktime_get_ns();

    struct qstr d_name = de->d_name;
    val.name_len = d_name.len;
    bpf_probe_read_kernel(&val.name, sizeof(val.name), d_name.name);
    bpf_get_current_comm(&val.comm, sizeof(val.comm));
    entryinfo.update(&pid, &val);

    return 0;
}

int trace_read_entry(struct pt_regs *ctx, struct file *file,
    char __user *buf, size_t count)
{
    // skip non-sync I/O; see kernel code for __vfs_read()
    if (!(file->f_op->read_iter))
        return 0;
    return trace_rw_entry(ctx, file, buf, count);
}

int trace_write_entry(struct pt_regs *ctx, struct file *file,
    char __user *buf, size_t count)
{
    // skip non-sync I/O; see kernel code for __vfs_write()
    if (!(file->f_op->write_iter))
        return 0;
    return trace_rw_entry(ctx, file, buf, count);
}

// output
static int trace_rw_return(struct pt_regs *ctx, int type)
{
    struct val_t *valp;
    u32 pid = bpf_get_current_pid_tgid();

    valp = entryinfo.lookup(&pid);
    if (valp == 0) {
        // missed tracing issue or filtered
        return 0;
    }
    u64 delta_us = (bpf_ktime_get_ns() - valp->ts) / 1000;
    entryinfo.delete(&pid);
    if (delta_us < MIN_US)  //过滤掉page cache操作
        return 0;

    struct data_t data = {};
    data.mode = type;
    data.pid = pid;
    data.sz = valp->sz;
    data.delta_us = delta_us;
    data.name_len = valp->name_len;
    bpf_probe_read_kernel(&data.name, sizeof(data.name), valp->name);
    bpf_probe_read_kernel(&data.comm, sizeof(data.comm), valp->comm);
    events.perf_submit(ctx, &data, sizeof(data));

    return 0;
}

int trace_read_return(struct pt_regs *ctx)
{
    return trace_rw_return(ctx, MODE_READ);
}

int trace_write_return(struct pt_regs *ctx)
{
    return trace_rw_return(ctx, MODE_WRITE);
}

"""
bpf_text = bpf_text.replace('MIN_US', str(min_ms * 1000))
if args.tgid:
    bpf_text = bpf_text.replace('TGID_FILTER', 'tgid != %d' % tgid)
else:
    bpf_text = bpf_text.replace('TGID_FILTER', '0')
if args.all_files:
    bpf_text = bpf_text.replace('TYPE_FILTER', '0')
else:
    bpf_text = bpf_text.replace('TYPE_FILTER', '!S_ISREG(mode)')

if debug or args.ebpf:
    print(bpf_text)
    if args.ebpf:
        exit()

# initialize BPF
b = BPF(text=bpf_text)

# I'd rather trace these via new_sync_read/new_sync_write (which used to be
# do_sync_read/do_sync_write), but those became static. So trace these from
# the parent functions, at the cost of more overhead, instead.
# Ultimately, we should be using [V]FS tracepoints.
try:
    b.attach_kprobe(event="__vfs_read", fn_name="trace_read_entry")
    b.attach_kretprobe(event="__vfs_read", fn_name="trace_read_return")
except Exception:
    print('Current kernel does not have __vfs_read, try vfs_read instead')
    b.attach_kprobe(event="vfs_read", fn_name="trace_read_entry")
    b.attach_kretprobe(event="vfs_read", fn_name="trace_read_return")
try:
    b.attach_kprobe(event="__vfs_write", fn_name="trace_write_entry")
    b.attach_kretprobe(event="__vfs_write", fn_name="trace_write_return")
except Exception:
    print('Current kernel does not have __vfs_write, try vfs_write instead')
    b.attach_kprobe(event="vfs_write", fn_name="trace_write_entry")
    b.attach_kretprobe(event="vfs_write", fn_name="trace_write_return")
ext4slower
ext4slower:ext4slower会跟踪ext4文件系统的读/写/打开和fsyncs等操作,并在超过阈值后打印信息,借此排查慢速IO问题,该工具可以在 VFS->文件系统接口层面进行跟踪,内核态代码如下:
针对四种操作类型R/W/O/S的监控路径,比较单一,仅仅是基于kprobe/kretprobe的耗时,四种类型之间没有计算关联
kprobe(xxx):在 xxx开始时记录时间戳,并通过map保存参数iocb->ki_filp(file指针),供kretprobe使用kretprobe(xxx):在 xxx结束时再次获取时间,计算出耗时,并且能够访问到xxx内核函数的返回值
由于通常的磁盘I/O处理是异步的,因此不太适合在VFS实现这个需求,所以比较适合在文件系统层次分析慢速磁盘I/O
# define BPF program
bpf_text = """
......

// XXX: switch these to char's when supported
#define TRACE_READ      0
#define TRACE_WRITE     1
#define TRACE_OPEN      2
#define TRACE_FSYNC     3

struct val_t {
    u64 ts;
    u64 offset;
    struct file *fp;        //定义file * 指针,在map中传递
};

struct data_t {
    // XXX: switch some to u32's when supported
    u64 ts_us;
    u64 type;
    u32 size;
    u64 offset;
    u64 delta_us;
    u32 pid;
    char task[TASK_COMM_LEN];
    char file[DNAME_INLINE_LEN];
};

BPF_HASH(entryinfo, u64, struct val_t);
BPF_PERF_OUTPUT(events);

//
// Store timestamp and size on entry
//

// The current ext4 (Linux 4.5) uses generic_file_read_iter(), instead of it's
// own function, for reads. So we need to trace that and then filter on ext4,
// which I do by checking file->f_op.
// The new Linux version (since form 4.10) uses ext4_file_read_iter(), And if the 'CONFIG_FS_DAX'
// is not set, then ext4_file_read_iter() will call generic_file_read_iter(), else it will call
// ext4_dax_read_iter(), and trace generic_file_read_iter() will fail.
int trace_read_entry(struct pt_regs *ctx, struct kiocb *iocb)
{
    u64 id =  bpf_get_current_pid_tgid();
    u32 pid = id >> 32; // PID is higher part

    if (FILTER_PID)
        return 0;

    // ext4 filter on file->f_op == ext4_file_operations
    struct file *fp = iocb->ki_filp;
    if ((u64)fp->f_op != EXT4_FILE_OPERATIONS)
        return 0;

    // store filep and timestamp by id
    struct val_t val = {};
    val.ts = bpf_ktime_get_ns();
    val.fp = fp;            //保存struct file *
    val.offset = iocb->ki_pos;
    if (val.fp)
        entryinfo.update(&id, &val);

    return 0;
}

// ext4_file_write_iter():
int trace_write_entry(struct pt_regs *ctx, struct kiocb *iocb)
{
    u64 id = bpf_get_current_pid_tgid();
    u32 pid = id >> 32; // PID is higher part

    if (FILTER_PID)
        return 0;

    // store filep and timestamp by id
    struct val_t val = {};
    val.ts = bpf_ktime_get_ns();
    val.fp = iocb->ki_filp;
    val.offset = iocb->ki_pos;
    if (val.fp)
        entryinfo.update(&id, &val);

    return 0;
}

// ext4_file_open():
int trace_open_entry(struct pt_regs *ctx, struct inode *inode,
    struct file *file)
{
    u64 id = bpf_get_current_pid_tgid();
    u32 pid = id >> 32; // PID is higher part

    if (FILTER_PID)
        return 0;

    // store filep and timestamp by id
    struct val_t val = {};
    val.ts = bpf_ktime_get_ns();
    val.fp = file;
    val.offset = 0;
    if (val.fp)
        entryinfo.update(&id, &val);

    return 0;
}

// ext4_sync_file():
int trace_fsync_entry(struct pt_regs *ctx, struct file *file)
{
    u64 id = bpf_get_current_pid_tgid();
    u32 pid = id >> 32; // PID is higher part

    if (FILTER_PID)
        return 0;

    // store filep and timestamp by id
    struct val_t val = {};
    val.ts = bpf_ktime_get_ns();
    val.fp = file;
    val.offset = 0;
    if (val.fp)
        entryinfo.update(&id, &val);

    return 0;
}

static int trace_return(struct pt_regs *ctx, int type)
{
    struct val_t *valp;
    u64 id = bpf_get_current_pid_tgid();
    u32 pid = id >> 32; // PID is higher part

    valp = entryinfo.lookup(&id);
    if (valp == 0) {
        // missed tracing issue or filtered
        return 0;
    }

    // calculate delta
    u64 ts = bpf_ktime_get_ns();
    u64 delta_us = (ts - valp->ts) / 1000;
    // 每统计一次事件就删除
    entryinfo.delete(&id);
    if (FILTER_US)
        return 0;

    // populate output struct
    struct data_t data = {};
    data.type = type;
    data.size = PT_REGS_RC(ctx);
    data.delta_us = delta_us;
    data.pid = pid;
    data.ts_us = ts / 1000;
    data.offset = valp->offset;
    bpf_get_current_comm(&data.task, sizeof(data.task));

    // workaround (rewriter should handle file to d_name in one step):
    struct dentry *de = NULL;
    struct qstr qs = {};
    de = valp->fp->f_path.dentry;
    qs = de->d_name;
    if (qs.len == 0)
        return 0;
    bpf_probe_read_kernel(&data.file, sizeof(data.file), (void *)qs.name);

    // output
    events.perf_submit(ctx, &data, sizeof(data));

    return 0;
}

int trace_read_return(struct pt_regs *ctx)
{
    return trace_return(ctx, TRACE_READ);
}

int trace_write_return(struct pt_regs *ctx)
{
    return trace_return(ctx, TRACE_WRITE);
}

int trace_open_return(struct pt_regs *ctx)
{
    return trace_return(ctx, TRACE_OPEN);
}

int trace_fsync_return(struct pt_regs *ctx)
{
    return trace_return(ctx, TRACE_FSYNC);
}
"""
对hook点兼容性的处理,主要是ext4_file_read_iter与generic_file_read_iter(代码注释已说明):
# initialize BPF
b = BPF(text=bpf_text)

# Common file functions. See earlier comment about generic_file_read_iter().
if BPF.get_kprobe_functions(b'ext4_file_read_iter'):
    b.attach_kprobe(event="ext4_file_read_iter", fn_name="trace_read_entry")
else:
    b.attach_kprobe(event="generic_file_read_iter", fn_name="trace_read_entry")
b.attach_kprobe(event="ext4_file_write_iter", fn_name="trace_write_entry")
b.attach_kprobe(event="ext4_file_open", fn_name="trace_open_entry")
b.attach_kprobe(event="ext4_sync_file", fn_name="trace_fsync_entry")
if BPF.get_kprobe_functions(b'ext4_file_read_iter'):
    b.attach_kretprobe(event="ext4_file_read_iter", fn_name="trace_read_return")
else:
    b.attach_kretprobe(event="generic_file_read_iter", fn_name="trace_read_return")
b.attach_kretprobe(event="ext4_file_write_iter", fn_name="trace_write_return")
b.attach_kretprobe(event="ext4_file_open", fn_name="trace_open_return")
b.attach_kretprobe(event="ext4_sync_file", fn_name="trace_fsync_return")
xfsslower
原理同ext4slower,统计一段时间内存 XFS 文件系统中文件的读写时间
T: 文件类型:R(常规文件),S(Socket),O(other)OFF_KB:File offset
biolatency
filegone:追踪文件重命名/删除
实现机制是在vfs_rename中追踪文件重命名操作,在vfs_unlink中追踪文件删除操作,兼顾了内核兼容性
[root@VM-X-X-centos tools]# python3 filegone.py
TIME     PID     COMM             ACTION FILE
18:22:49 702124 in:imjournal     82 imjournal.state.tmp > imjournal.state
18:22:58 1665296 bash             68 sh-thd.zsIEk6
18:22:58 1665337 rm               68 ttttt
filetop:文件读写数据量TOP
该工具用于统计一段时间内读写较高的文件,主要是基于vfs_read/vfs_write做统计,输出格式说明:
READS/WRITES:读写次数R_Kb/W_Kb:读写数据量T:文件类型,R(常规文件),S(Socket),O(other)
采样输出如下,仅记录文件读写类型,读写失败时也将被记录
16:15:30 loadavg: 0.16 0.10 0.06 1/379 1579177

TID     COMM             READS  WRITES R_Kb    W_Kb    T FILE
764728  sap1002          12     0      61439   0       R sockstat
3274711 sap1008          15     0      10500   0       R execve_info
764730  sap1003          12     0      95      0       R cmdline
764730  sap1003          12     0      95      0       R cmdline
1579177 python3          10     0      90      0       R cmdline
内核态代码如下,关注下面这几个成员的获取及判断。实现原理是通过追踪kprobe/vfs_read和kprobe/vfs_write的调用,记录文件操作类型、读写大小、文件名(denty name)等信息
- inode:
file->f_inode->i_ino - dev:
file->f_inode->i_sb->s_dev - rdev:
file->f_inode->i_rdev - mode:
file->f_inode->i_mode - parent inode:
file->f_path.dentry->d_parent->d_inode->i_ino
# define BPF program
bpf_text = """
#include <uapi/linux/ptrace.h>
#include <linux/blkdev.h>

enum { __BCC_DNAME_INLINE_LEN = DNAME_INLINE_LEN };
#undef DNAME_INLINE_LEN
#define DNAME_INLINE_LEN __BCC_DNAME_INLINE_LEN

// the key for the output summary
struct info_t {
    unsigned long inode;
    dev_t dev;
    dev_t rdev;
    u32 pid;
    u32 name_len;
    char comm[TASK_COMM_LEN];
    // de->d_name.name may point to de->d_iname so limit len accordingly
    char name[DNAME_INLINE_LEN];
    char type;
};

// the value of the output summary
struct val_t {
    u64 reads;
    u64 writes;
    u64 rbytes;
    u64 wbytes;
};

BPF_HASH(counts, struct info_t, struct val_t);

// vfs_read/vfs_write的参数
static int do_entry(struct pt_regs *ctx, struct file *file,
    char __user *buf, size_t count, int is_read)
{
    u32 tgid = bpf_get_current_pid_tgid() >> 32;
    if (TGID_FILTER)
        return 0;

    u32 pid = bpf_get_current_pid_tgid();

    // skip I/O lacking a filename
    struct dentry *de = file->f_path.dentry;
    int mode = file->f_inode->i_mode;
    struct qstr d_name = de->d_name;   //获取dentry的qstr
    if (d_name.len == 0 || TYPE_FILTER)
        return 0;

    // skip if not in the specified directory
    if (DIRECTORY_FILTER)
        return 0;

    // store counts and sizes by pid & file
    struct info_t info = {
        .pid = pid,
        .inode = file->f_inode->i_ino,
        .dev = file->f_inode->i_sb->s_dev,
        .rdev = file->f_inode->i_rdev,
    };
    bpf_get_current_comm(&info.comm, sizeof(info.comm));
    info.name_len = d_name.len;
    bpf_probe_read_kernel(&info.name, sizeof(info.name), d_name.name);
    if (S_ISREG(mode)) {
        info.type = 'R';
    } else if (S_ISSOCK(mode)) {
        info.type = 'S';
    } else {
        info.type = 'O';
    }

    struct val_t *valp, zero = {};
    valp = counts.lookup_or_try_init(&info, &zero);
    if (valp) {
        if (is_read) {
            valp->reads++;
            // 累加读数据
            valp->rbytes += count;
        } else {
            valp->writes++;
            // 累加写数据
            valp->wbytes += count;
        }
    }

    return 0;
}

int trace_read_entry(struct pt_regs *ctx, struct file *file,
    char __user *buf, size_t count)
{
    return do_entry(ctx, file, buf, count, 1);
}

int trace_write_entry(struct pt_regs *ctx, struct file *file,
    char __user *buf, size_t count)
{
    return do_entry(ctx, file, buf, count, 0);
}
"""

......

if args.directory:
    try:
        directory_inode = os.lstat(args.directory)[stat.ST_INO]
        print(f'Tracing directory: {args.directory} (Inode: {directory_inode})')
        bpf_text = bpf_text.replace('DIRECTORY_FILTER',  'file->f_path.dentry->d_parent->d_inode->i_ino != %d' % directory_inode)
    except (FileNotFoundError, PermissionError) as e:
        print(f'Error accessing directory {args.directory}: {e}')
        exit(1)


# initialize BPF
b = BPF(text=bpf_text)
if args.read_only and args.write_only:
    raise Exception("Both read-only and write-only flags passed")
elif args.read_only:
    b.attach_kprobe(event="vfs_read", fn_name="trace_read_entry")
elif args.write_only:
    b.attach_kprobe(event="vfs_write", fn_name="trace_write_entry")
else:
    b.attach_kprobe(event="vfs_read", fn_name="trace_read_entry")
    b.attach_kprobe(event="vfs_write", fn_name="trace_write_entry")
biosnoop
biosnoop跟踪每个块设备的I/O,并打印每个I/O的延迟,使用时可以结合biolatency工具,首先使用python3 biolatency.py -D找出延迟(分布)大的磁盘,然后使用biosnoop找出导致延迟的进程
statsnoop
使用statfs/newstat/statx/newfstatat/newlstat等相关的kprobe/kretprobe的hook点,比如PATH命令位置定位场景,在终端输入vi[TAB],当触发补全时,就会触发stat系统调用。
说明:终端bash经常会使用stat判断命令在哪个地方,如bash中使用Tab键自动补全命令,bash会根据环境变量PATH中的路径检索ls在哪个位置,检索便是通过stat获取文件信息,如stat("/usr/bin/ls"),如成功则找到ls命令位置
PID     COMM               FD ERR PATH
1665296 bash               -1   2 vi
1665296 bash               -1   2 view
1665296 bash               -1   2 vigr
1665296 bash               -1   2 vim
1665296 bash               -1   2 vimdiff
1665296 bash               -1   2 vimdot
1665296 bash               -1   2 vimtutor
1665296 bash               -1   2 vipw
1665296 bash               -1   2 virt-what
1665296 bash               -1   2 visudo
# define BPF program
bpf_text = """
......

enum sys_type {
    SYS_STAT = 1,
    SYS_STATX,
    SYS_STATFS,
    SYS_NEWSTAT,
    SYS_NEWLSTAT,
    SYS_FSTATAT64,
    SYS_NEWFSTATAT,
};

struct val_t {
    const char *fname;
    enum sys_type type;
};

struct data_t {
    u32 pid;
    u64 ts_ns;
    int ret;
    char comm[TASK_COMM_LEN];
    char fname[NAME_MAX];
    u32 type; /* enum sys_type */
};

BPF_HASH(infotmp, u32, struct val_t);
BPF_PERF_OUTPUT(events);

static int trace_entry(struct pt_regs *ctx, enum sys_type type,
                       const char __user *filename)
{
    struct val_t val = {};
    u64 pid_tgid = bpf_get_current_pid_tgid();
    u32 pid = pid_tgid >> 32;
    u32 tid = (u32)pid_tgid;

    FILTER
    val.fname = filename;
    val.type = type;
    infotmp.update(&tid, &val);

    return 0;
};

int syscall__stat_entry(struct pt_regs *ctx, const char __user *filename)
{
    return trace_entry(ctx, SYS_STAT, filename);
}

int syscall__statfs_entry(struct pt_regs *ctx, const char __user *filename)
{
    return trace_entry(ctx, SYS_STATFS, filename);
}

int syscall__newstat_entry(struct pt_regs *ctx, const char __user *filename)
{
    return trace_entry(ctx, SYS_NEWSTAT, filename);
}

int syscall__newlstat_entry(struct pt_regs *ctx, const char __user *filename)
{
    return trace_entry(ctx, SYS_NEWLSTAT, filename);
}

int syscall__statx_entry(struct pt_regs *ctx, int dfd, const char __user *filename)
{
    return trace_entry(ctx, SYS_STATX, filename);
}

int syscall__fstatat64_entry(struct pt_regs *ctx, int dfd, const char __user *filename)
{
    return trace_entry(ctx, SYS_FSTATAT64, filename);
}

int syscall__newfstatat_entry(struct pt_regs *ctx, int dfd, const char __user *filename)
{
    return trace_entry(ctx, SYS_NEWFSTATAT, filename);
}

int trace_return(struct pt_regs *ctx)
{
    u64 pid_tgid = bpf_get_current_pid_tgid();
    u32 tid = (u32)pid_tgid;
    struct val_t *valp;

    valp = infotmp.lookup(&tid);
    if (valp == 0) {
        // missed entry
        return 0;
    }

    struct data_t data = {.pid = pid_tgid >> 32};
    bpf_probe_read_user(&data.fname, sizeof(data.fname), (void *)valp->fname);
    data.type = valp->type;
    bpf_get_current_comm(&data.comm, sizeof(data.comm));
    data.ts_ns = bpf_ktime_get_ns();
    data.ret = PT_REGS_RC(ctx);

    events.perf_submit(ctx, &data, sizeof(data));
    infotmp.delete(&tid);

    return 0;
}
"""
......

# initialize BPF
b = BPF(text=bpf_text)

# for POSIX compliance, all architectures implement these
# system calls but the name of the actual entry point may
# be different for which we must check if the entry points
# actually exist before attaching the probes
def try_attach_syscall_probes(syscall):
    # src/python/bcc/__init__.py
    syscall_fnname = b.get_syscall_fnname(syscall)
    if BPF.ksymname(syscall_fnname) != -1:
        b.attach_kprobe(event=syscall_fnname, fn_name="syscall__%s_entry" % syscall)
        b.attach_kretprobe(event=syscall_fnname, fn_name="trace_return")

try_attach_syscall_probes("stat")
try_attach_syscall_probes("statx")
try_attach_syscall_probes("statfs")
try_attach_syscall_probes("newstat")
try_attach_syscall_probes("newlstat")
try_attach_syscall_probes("fstatat64")
try_attach_syscall_probes("newfstatat")
# Given a syscall's name, return the full Kernel function name with current
# system's syscall prefix. For example, given "clone" the helper would
# return "sys_clone" or "__x64_sys_clone".
def get_syscall_fnname(self, name):
    name = _assert_is_bytes(name)
    return self.get_syscall_prefix() + name
dcstat:dentry cache 状态(不完善)
dcstat工具用于统计Linux内核中目录缓存 dcache 的查找命中情况,通过统计快速查找lookup_fast和慢速查找d_lookup的次数以及dcache缓存miss的情况
dcstat工具关联的hook调用如下,实现主要包含两个eBPF程序:
count_fast函数:挂载在lookup_fast内核函数上,每当该函数被调用时就增加快速查找计数器S_REFScount_lookup函数:挂载在d_lookup内核函数的返回点上,增加慢速查找计数器S_SLOW,如果返回NULL则再增加未命中计数器S_MISS
b.attach_kprobe(event_re=r'^lookup_fast$|^lookup_fast.constprop.*.\d$', fn_name="count_fast")
b.attach_kretprobe(event="d_lookup", fn_name="count_lookup")
理解dcstat的工作流程需要对查找dentry cache机制特别熟悉,count_fast方法记录所有通过缓存查找路径的调用,不论是RCU还是普通锁,其中d_lookup是慢速的普通锁。统计这些函数的调用次数以及根据返回值判断查找缓存是否成功
#page cache命中率降低会增加硬盘IO
[root@VM-218-158-centos tools]# python3 dcstat.py
TIME         REFS/s   SLOW/s   MISS/s     HIT%
22:09:11:       454        7        7    98.46
22:09:12:       443        7        6    98.65
22:09:13:      8367     1277       17    99.80
22:09:14:      4007      260       35    99.13
22:09:15:       498       10        6    98.80
22:09:16:     15420     1693      205    98.67
内核态代码如下:
# define BPF program
bpf_text = """
#include <uapi/linux/ptrace.h>

enum stats {
    S_REFS = 1,
    S_SLOW,
    S_MISS,
    S_MAXSTAT
};

BPF_ARRAY(stats, u64, S_MAXSTAT);

/*
 * How this is instrumented, and how to interpret the statistics, is very much
 * tied to the current kernel implementation (this was written on Linux 4.4).
 * This will need maintenance to keep working as the implementation changes. To
 * aid future adventurers, this is is what the current code does, and why.
 *
 * First problem: the current implementation takes a path and then does a
 * lookup of each component. So how do we count a reference? Once for the path
 * lookup, or once for every component lookup? I've chosen the latter
 * since it seems to map more closely to actual dcache lookups (via
 * __d_lookup_rcu()). It's counted via calls to lookup_fast().
 *
 * The implementation tries different, progressively slower, approaches to
 * lookup a file. At what point do we call it a dcache miss? I've chosen when
 * a d_lookup() (which is called during lookup_slow()) returns zero.
 *
 * I've also included a "SLOW" statistic to show how often the fast lookup
 * failed. Whether this exists or is interesting is an implementation detail,
 * and the "SLOW" statistic may be removed in future versions.
 */
void count_fast(struct pt_regs *ctx) {
    int key = S_REFS;
    stats.atomic_increment(key);
}

void count_lookup(struct pt_regs *ctx) {
    int key = S_SLOW;
    stats.atomic_increment(key);
    if (PT_REGS_RC(ctx) == 0) {
        key = S_MISS;
        stats.atomic_increment(key);
    }
}
"""

# load BPF program
b = BPF(text=bpf_text)
b.attach_kprobe(event_re=r'^lookup_fast$|^lookup_fast.constprop.*.\d$', fn_name="count_fast")
b.attach_kretprobe(event="d_lookup", fn_name="count_lookup")

# stat column labels and indexes
stats = {
    "REFS": 1,
    "SLOW": 2,
    "MISS": 3
}
注意,本实现(统计)未必会严谨,从内核版本(4.11.6)代码来看:
- 快速查找未命中(返回值
<=0)未被统计:当lookup_fast查找失败时,原始实现代码没有统计这部分未命中情况。lookup_fast函数内部会调用__d_lookup_rcu(RCU-walk快速查找)或__d_lookup(非RCU模式)进行实际查找,如果查找失败应该被计入未命中 - 统计分类可能不准确:
lookup_fast函数在非RCU模式下会调用__d_lookup函数进行查找,这与d_lookup函数调用的路径相同,导致快速查找可能被错误地归类为慢速查找 lookup_fast函数包含了RCU查找以及ref查找的一部分逻辑,共同点都是会直接操作dcache,所以原方案直接统计lookup_fast的调用次数也可以直接反映dcache的查找情况
如何优化呢?可以基于kretprobe在__d_lookup_rcu(count_fast)、__d_lookup(count_lookup)内核函数做hook,增加对返回值的检查与统计(若返回NULL则增加未命中计数器)
dcsnoop
按文件名显示dentry cache缓存命中情况,M代表缓冲未命中,R代表缓存命中,和dcstat工具原理一致,仅显示方式不同
[root@VM-X-X-centos tools]# python3 dcsnoop.py
TIME(s)     PID     COMM             T FILE
0.015185    764728  sap1002          M sockstat
0.099943    544     systemd-journal  M log-extra-fields:nscd.service
0.164748    764728  sap1002          M sockstat
0.222522    764728  sap1002          M cgroup
0.222598    764728  sap1002          M environ
0.222633    764728  sap1002          M 2
0.264027    764728  sap1002          M cgroup
0.264119    764728  sap1002          M status
0.264156    764728  sap1002          M cmdline
0.264186    764728  sap1002          M environ
# define BPF program
bpf_text = """
#include <uapi/linux/ptrace.h>
#include <linux/fs.h>
#include <linux/sched.h>

#define MAX_FILE_LEN  64

enum lookup_type {
    LOOKUP_MISS,
    LOOKUP_REFERENCE,
};

struct entry_t {
    char name[MAX_FILE_LEN];
};

BPF_HASH(entrybypid, u32, struct entry_t);

struct data_t {
    u32 pid;
    enum lookup_type type;
    char comm[TASK_COMM_LEN];
    char filename[MAX_FILE_LEN];
};

BPF_PERF_OUTPUT(events);

/* from fs/namei.c: */
struct nameidata {
        struct path     path;
        struct qstr     last;
};

static inline
void submit_event(struct pt_regs *ctx, void *name, int type, u32 pid)
{
    struct data_t data = {
        .pid = pid,
        .type = type,
    };
    bpf_get_current_comm(&data.comm, sizeof(data.comm));
    bpf_probe_read_kernel(&data.filename, sizeof(data.filename), name);
    events.perf_submit(ctx, &data, sizeof(data));
}

int trace_fast(struct pt_regs *ctx, struct nameidata *nd, struct path *path)
{
    u32 pid = bpf_get_current_pid_tgid() >> 32;
    submit_event(ctx, (void *)nd->last.name, LOOKUP_REFERENCE, pid);
    return 1;
}

// 自动加载kprobe的方式
int kprobe__d_lookup(struct pt_regs *ctx, const struct dentry *parent,
    const struct qstr *name)
{
    u32 tid = bpf_get_current_pid_tgid();
    struct entry_t entry = {};
    const char *fname = name->name;
    if (fname) {
        bpf_probe_read_kernel(&entry.name, sizeof(entry.name), (void *)fname);
    }
    entrybypid.update(&tid, &entry);
    return 0;
}

// 自动加载kprobe的方式
int kretprobe__d_lookup(struct pt_regs *ctx)
{
    u64 pid_tgid = bpf_get_current_pid_tgid();
    u32 pid = pid_tgid >> 32;
    u32 tid = (u32)pid_tgid;
    struct entry_t *ep;

    ep = entrybypid.lookup(&tid);
    if (ep == 0) {
        return 0;   // missed entry
    }
    if (PT_REGS_RC(ctx) != 0) {
        entrybypid.delete(&tid);
        return 0;   // lookup didn't fail
    }

    submit_event(ctx, (void *)ep->name, LOOKUP_MISS, pid);
    entrybypid.delete(&tid);
    return 0;
}
"""
......

# initialize BPF
b = BPF(text=bpf_text)
if args.all:
    b.attach_kprobe(event_re=r'^lookup_fast$|^lookup_fast.constprop.*.\d$', fn_name="trace_fast")

mode_s = {
    0: 'M',
    1: 'R',
}
fsdist[ext4dist]:文件系统操作时间直方图
以ext4dist为例,该工具用于统计文件系统操作时间直方图
[root@VM-X-X-centos tools]# python3 ext4dist.py
Tracing ext4 operation latency... Hit Ctrl-C to end.
^C

operation = read
     usecs               : count     distribution
         0 -> 1          : 5706     |****************************************|
         2 -> 3          : 206      |*                                       |
         4 -> 7          : 33       |                                        |
         8 -> 15         : 15       |                                        |
        16 -> 31         : 2        |                                        |
        32 -> 63         : 0        |                                        |
        64 -> 127        : 2        |                                        |
       128 -> 255        : 2        |                                        |
       256 -> 511        : 1        |                                        |
       512 -> 1023       : 0        |                                        |
      1024 -> 2047       : 1        |                                        |

operation = open
     usecs               : count     distribution
         0 -> 1          : 5155     |****************************************|
         2 -> 3          : 176      |*                                       |
         4 -> 7          : 12       |                                        |
         8 -> 15         : 9        |                                        |
        16 -> 31         : 4        |                                        |
        32 -> 63         : 0        |                                        |
        64 -> 127        : 4        |                                        |
       128 -> 255        : 1        |                                        |
       256 -> 511        : 4        |                                        |
       512 -> 1023       : 0        |                                        |
      1024 -> 2047       : 0        |                                        |
      2048 -> 4095       : 1        |                                        |

operation = write
     usecs               : count     distribution
         0 -> 1          : 1        |*                                       |
         2 -> 3          : 11       |************                            |
         4 -> 7          : 11       |************                            |
         8 -> 15         : 14       |***************                         |
        16 -> 31         : 36       |****************************************|
        32 -> 63         : 4        |****                                    |
        64 -> 127        : 4        |****                                    |
       128 -> 255        : 0        |                                        |
       256 -> 511        : 0        |                                        |
       512 -> 1023       : 3        |***                                     |
      1024 -> 2047       : 3        |***                                     |

operation = fsync
     usecs               : count     distribution
         0 -> 1          : 0        |                                        |
         2 -> 3          : 0        |                                        |
         4 -> 7          : 0        |                                        |
         8 -> 15         : 0        |                                        |
        16 -> 31         : 0        |                                        |
        32 -> 63         : 0        |                                        |
        64 -> 127        : 0        |                                        |
       128 -> 255        : 0        |                                        |
       256 -> 511        : 0        |                                        |
       512 -> 1023       : 0        |                                        |
      1024 -> 2047       : 0        |                                        |
      2048 -> 4095       : 0        |                                        |
      4096 -> 8191       : 0        |                                        |
      8192 -> 16383      : 0        |                                        |
     16384 -> 32767      : 1        |****************************************|
该工具主要用于统计文件系统中具体实现如read/write/sync/open时间消耗,延迟的增加可能是硬盘缓存命中率低/硬盘速度慢,也可能是CPU负载较高导致。工具的内核态实现逻辑也比较直观,利用ext4*相关的操作函数,通过kprobe入口使用map保存起始时间,通过kretprobe入口使用map计算耗时,然后加入直方图统计。此外,在用户态定时输出直方图与清空即可
while (1):
    ......
    dist.print_log2_hist(label, "operation", section_print_fn=bytes.decode)
    dist.clear()
    ......
以ext4文件系统为例,介绍下这里涉及到VFS的原理,struct file_operations成员中的函数指针指向文件系统具体如何实现对应的操作,如read_iter函数指针指向的ext4_file_read_iter是ext4文件系统实现读取文件的具体实现,对于写操作而言,ext4文件系统等普遍使用write_iter,write_iter具有更强的功能性能
//https://elixir.bootlin.com/linux/v4.11.6/source/fs/ext4/file.c#L720
const struct file_operations ext4_file_operations = {
	.read_iter	= ext4_file_read_iter,      //for READ
	.write_iter	= ext4_file_write_iter,     //for WRITE
	.open		= ext4_file_open,           //for OPEN
	.fsync		= ext4_sync_file,           //for FSYNC
};
内核态代码如下:
# define BPF program
bpf_text = """
#include <uapi/linux/ptrace.h>
#include <linux/fs.h>
#include <linux/sched.h>

#define OP_NAME_LEN 8
typedef struct dist_key {
    char op[OP_NAME_LEN];
    u64 slot;
} dist_key_t;
BPF_HASH(start, u32);
BPF_HISTOGRAM(dist, dist_key_t);

// time operation
int trace_entry(struct pt_regs *ctx)
{
    u64 pid_tgid = bpf_get_current_pid_tgid();
    u32 pid = pid_tgid >> 32;
    u32 tid = (u32)pid_tgid;

    if (FILTER_PID)
        return 0;
    u64 ts = bpf_ktime_get_ns();
    start.update(&tid, &ts);
    return 0;
}

EXT4_TRACE_READ_CODE

static int trace_return(struct pt_regs *ctx, const char *op)
{
    u64 *tsp;
    u64 pid_tgid = bpf_get_current_pid_tgid();
    u32 pid = pid_tgid >> 32;
    u32 tid = (u32)pid_tgid;

    // fetch timestamp and calculate delta
    tsp = start.lookup(&tid);
    if (tsp == 0) {
        return 0;   // missed start or filtered
    }
    u64 delta = bpf_ktime_get_ns() - *tsp;
    start.delete(&tid);

    // Skip entries with backwards time: temp workaround for 728
    if ((s64) delta < 0)
        return 0;

    delta /= FACTOR;

    // store as histogram
    dist_key_t key = {.slot = bpf_log2l(delta)};
    __builtin_memcpy(&key.op, op, sizeof(key.op));
    dist.atomic_increment(key);

    return 0;
}

int trace_read_return(struct pt_regs *ctx)
{
    char *op = "read";
    return trace_return(ctx, op);
}

int trace_write_return(struct pt_regs *ctx)
{
    char *op = "write";
    return trace_return(ctx, op);
}

int trace_open_return(struct pt_regs *ctx)
{
    char *op = "open";
    return trace_return(ctx, op);
}

int trace_fsync_return(struct pt_regs *ctx)
{
    char *op = "fsync";
    return trace_return(ctx, op);
}
"""

# Starting from Linux 4.10 ext4_file_operations.read_iter has been changed from
# using generic_file_read_iter() to its own ext4_file_read_iter().
#
# To detect the proper function to trace check if ext4_file_read_iter() is
# defined in /proc/kallsyms, if it's defined attach to that function, otherwise
# use generic_file_read_iter() and inside the trace hook filter on ext4 read
# events (checking if file->f_op == ext4_file_operations).
if BPF.get_kprobe_functions(b'ext4_file_read_iter'):
    ext4_read_fn = 'ext4_file_read_iter'
    ext4_trace_read_fn = 'trace_entry'
    ext4_trace_read_code = ''
else:
    ext4_read_fn = 'generic_file_read_iter'
    ext4_trace_read_fn = 'trace_read_entry'
    ext4_file_ops_addr = ''
    with open(kallsyms) as syms:
        for line in syms:
            (addr, size, name) = line.rstrip().split(" ", 2)
            name = name.split("\t")[0]
            if name == "ext4_file_operations":
                ext4_file_ops_addr = "0x" + addr
                break
        if ext4_file_ops_addr == '':
            print("ERROR: no ext4_file_operations in /proc/kallsyms. Exiting.")
            print("HINT: the kernel should be built with CONFIG_KALLSYMS_ALL.")
            exit(1)
    ext4_trace_read_code = """
int trace_read_entry(struct pt_regs *ctx, struct kiocb *iocb)
{
    u64 pid_tgid = bpf_get_current_pid_tgid();
    u32 pid = pid_tgid >> 32;
    u32 tid = (u32)pid_tgid;

    if (FILTER_PID)
        return 0;

    // ext4 filter on file->f_op == ext4_file_operations
    struct file *fp = iocb->ki_filp;
    if ((u64)fp->f_op != %s)
        return 0;

    u64 ts = bpf_ktime_get_ns();
    start.update(&tid, &ts);
    return 0;
}""" % ext4_file_ops_addr

# code replacements
bpf_text = bpf_text.replace('EXT4_TRACE_READ_CODE', ext4_trace_read_code)
bpf_text = bpf_text.replace('FACTOR', str(factor))
if args.pid:
    bpf_text = bpf_text.replace('FILTER_PID', 'pid != %s' % pid)
else:
    bpf_text = bpf_text.replace('FILTER_PID', '0')
if debug or args.ebpf:
    print(bpf_text)
    if args.ebpf:
        exit()

# load BPF program
b = BPF(text=bpf_text)

b.attach_kprobe(event=ext4_read_fn, fn_name=ext4_trace_read_fn)
b.attach_kprobe(event="ext4_file_write_iter", fn_name="trace_entry")
b.attach_kprobe(event="ext4_file_open", fn_name="trace_entry")
b.attach_kprobe(event="ext4_sync_file", fn_name="trace_entry")
b.attach_kretprobe(event=ext4_read_fn, fn_name='trace_read_return')
b.attach_kretprobe(event="ext4_file_write_iter", fn_name="trace_write_return")
b.attach_kretprobe(event="ext4_file_open", fn_name="trace_open_return")
b.attach_kretprobe(event="ext4_sync_file", fn_name="trace_fsync_return")
dirtop:追踪目录内文件的读写操作
仅能追踪目录内(包括目录下的递归子目录)已存在文件的读写追踪,新建文件不能追踪。其工作逻辑是,在启动前收集目录内文件的inode值,在kprobe/vfs_read和kprobe/vfs_write时根据参数struct file *file中的f_path.dentry->d_inode->i_ino获取此时读写文件的inode,判断是否是需要追踪的文件,则收集文件的读写次数、读写大小
#python3 dirtop.py -d /tmp/ -s all 10
READS  WRITES R_Kb     W_Kb     PATH
0      1      0        0        /tmp/
内核态实现:
# define BPF program
bpf_text = """
# include <uapi/linux/ptrace.h>
# include <linux/blkdev.h>

// the key for the output summary
struct info_t {
    unsigned long inode_id;
};

// the value of the output summary
struct val_t {
    u64 reads;
    u64 writes;
    u64 rbytes;
    u64 wbytes;
};

BPF_HASH(counts, struct info_t, struct val_t);

static int do_entry(struct pt_regs *ctx, struct file *file,
    char __user *buf, size_t count, int is_read)
{
    u32 tgid = bpf_get_current_pid_tgid() >> 32;
    if (TGID_FILTER)
        return 0;

    // The directory inodes we look at
    u32 dir_ids[INODES_NUMBER] =  DIRECTORY_INODES;
    struct info_t info = {.inode_id = 0};
    struct dentry *pde = file->f_path.dentry;

    // 遍历dentry树,最大50次
    for (int i=0; i<50; i++) {
        // If we don't have any parent, we reached the root
        if (!pde->d_parent) {
            break;
        }
        pde = pde->d_parent;
        // Does the files is part of the directory we look for
        for(int dir_id=0; dir_id<INODES_NUMBER; dir_id++) {
            if (pde->d_inode->i_ino == dir_ids[dir_id]) {
                //根据inode匹配了
                // Yes, let's export the top directory inode
                info.inode_id = pde->d_inode->i_ino;
                break;
            }
        }
    }
    // If we didn't found any, let's abort
    if (info.inode_id == 0) {
        return 0;
    }

    struct val_t *valp, zero = {};
    valp = counts.lookup_or_try_init(&info, &zero);
    if (valp) {
        if (is_read) {
            valp->reads++;
            valp->rbytes += count;
        } else {
            valp->writes++;
            valp->wbytes += count;
        }
    }
    return 0;
}

int trace_read_entry(struct pt_regs *ctx, struct file *file,
    char __user *buf, size_t count)
{
    return do_entry(ctx, file, buf, count, 1);
}

int trace_write_entry(struct pt_regs *ctx, struct file *file,
    char __user *buf, size_t count)
{
    return do_entry(ctx, file, buf, count, 0);
}

"""

# initialize BPF
b = BPF(text=bpf_text)
b.attach_kprobe(event="vfs_read", fn_name="trace_read_entry")
b.attach_kprobe(event="vfs_write", fn_name="trace_write_entry")
mountsnoop:追踪挂载/卸载文件系统
COMM             PID     TID     MNT_NS      CALL
mount            8647    8647    4026531840  mount("proc", "/root/xxx/proc", "proc", 0x0, "") = 0
该工具的hook点如下:
__x64_sys_fsopen:创建文件系统描述符,用于新的挂载操作(容器启动、虚拟文件系统创建)__x64_sys_mount:将文件系统挂载到指定目录(挂载源、挂载点、文件系统类型、挂载选项)__x64_sys_fsmount:新的文件系统挂载接口,提供更灵活的挂载机制,支持命名空间隔离__x64_sys_fsconfig:配置文件系统上下文,设置挂载参数、指定源设备、配置选项等__x64_sys_move_mount:在目录树中重新定位挂载点(容器文件系统重组、挂载点调整)__x64_sys_umount:卸载文件系统,解除文件系统与挂载点的关联
def main():
    ......
    b = bcc.BPF(text=bpf_text)

    mount_fnname = b.get_syscall_fnname("mount")
    # fsopne(2) syscall add since kernel commit 24dcb3d90a1f ("vfs: syscall:
    # Add fsopen() to prepare for superblock creation") v5.1-rc1-5-g24dcb3d90a1f
    fsopen_fnname = b.get_syscall_fnname("fsopen")
    # fsconfig(2) syscall add since kernel commit ecdab150fddb ("vfs: syscall:
    # Add fsconfig() for configuring and managing a context") v5.1-rc1-7-gecdab150fddb
    fsconfig_fnname = b.get_syscall_fnname("fsconfig")
    # fsmount(2) syscall add since kernel commit 93766fbd2696 ("vfs: syscall:
    # Add fsmount() to create a mount for a superblock") v5.1-rc1-8-g93766fbd2696
    fsmount_fnname = b.get_syscall_fnname("fsmount")
    # move_mount(2) syscall add since kernel commit 2db154b3ea8e ("vfs: syscall:
    # Add move_mount(2) to move mounts around"), v5.1-rc1-2-g2db154b3ea8e
    move_mount_fnname = b.get_syscall_fnname("move_mount")
    umount_fnname = b.get_syscall_fnname("umount")

    if b.ksymname(fsopen_fnname) == -1:
        fsopen_fnname = None
    if b.ksymname(fsconfig_fnname) == -1:
        fsconfig_fnname = None
    if b.ksymname(fsmount_fnname) == -1:
        fsmount_fnname = None
    if b.ksymname(move_mount_fnname) == -1:
        move_mount_fnname = None

    b.attach_kprobe(event=mount_fnname, fn_name="syscall__mount")
    b.attach_kretprobe(event=mount_fnname, fn_name="do_ret_sys_mount")

    if fsopen_fnname:
        b.attach_kprobe(event=fsopen_fnname, fn_name="syscall__fsopen")
        b.attach_kretprobe(event=fsopen_fnname, fn_name="do_ret_sys_fsopen")
    if fsmount_fnname:
        b.attach_kprobe(event=fsmount_fnname, fn_name="syscall__fsmount")
        b.attach_kretprobe(event=fsmount_fnname, fn_name="do_ret_sys_fsmount")
    if fsconfig_fnname:
        b.attach_kprobe(event=fsconfig_fnname, fn_name="syscall__fsconfig")
        b.attach_kretprobe(event=fsconfig_fnname, fn_name="do_ret_sys_fsconfig")
    if move_mount_fnname:
        b.attach_kprobe(event=move_mount_fnname, fn_name="syscall__move_mount")
        b.attach_kretprobe(event=move_mount_fnname, fn_name="do_ret_sys_move_mount")

    #内核5.4.119-1-tlinux4-0008
    #b'__x64_sys_fsopen' b'__x64_sys_mount' b'__x64_sys_fsmount' b'__x64_sys_fsconfig' b'__x64_sys_move_mount' b'__x64_sys_umount'
    #print (fsopen_fnname,mount_fnname,fsmount_fnname,fsconfig_fnname,move_mount_fnname,umount_fnname)
    b.attach_kprobe(event=umount_fnname, fn_name="syscall__umount")
    b.attach_kretprobe(event=umount_fnname, fn_name="do_ret_sys_umount")
opensnoop
本工具用来实现对文件打开的追踪,支持对open/openat/openat2三种hook的kprobe/kretprobe的追踪
# initialize BPF
b = BPF(text=bpf_text)
if not is_support_kfunc:
    b.attach_kprobe(event=fnname_open, fn_name="syscall__trace_entry_open")
    b.attach_kretprobe(event=fnname_open, fn_name="trace_return")

    b.attach_kprobe(event=fnname_openat, fn_name="syscall__trace_entry_openat")
    b.attach_kretprobe(event=fnname_openat, fn_name="trace_return")

    if fnname_openat2:
        b.attach_kprobe(event=fnname_openat2, fn_name="syscall__trace_entry_openat2")
        b.attach_kretprobe(event=fnname_openat2, fn_name="trace_return")
内核态代码如下,值得注意是代码支持对FULLPATH的解析(open系列支持对相对路径的打开),即FULLPATH等于当前进程所在的目录再加上打开的文件路径
# define BPF program
bpf_text = """
#include <uapi/linux/ptrace.h>
#include <uapi/linux/limits.h>
#include <linux/fcntl.h>
#include <linux/sched.h>
#ifdef FULLPATH
#include <linux/fs_struct.h>
#include <linux/dcache.h>
#include <linux/fs.h>
#include <linux/mount.h>

/* see https://github.com/torvalds/linux/blob/master/fs/mount.h */
struct mount {
    struct hlist_node mnt_hash;
    struct mount *mnt_parent;
    struct dentry *mnt_mountpoint;
    struct vfsmount mnt;
    /* ... */
};
#endif

#define NAME_MAX 255
#define MAX_ENTRIES 32

struct val_t {
    u64 id;
    char comm[TASK_COMM_LEN];
    const char *fname;
    int flags; // EXTENDED_STRUCT_MEMBER
    u32 mode; // EXTENDED_STRUCT_MEMBER
};

struct data_t {
    u64 id;
    u64 ts;
    u32 uid;
    int ret;
    char comm[TASK_COMM_LEN];
    u32 path_depth;
#ifdef FULLPATH
    /**
     * Example: "/CCCCC/BB/AAAA"
     * name[]: "AAAA000000000000BB0000000000CCCCC00000000000"
     *          |<- NAME_MAX ->|
     *
     * name[] must be u8, because char [] will be truncated by ctypes.cast(),
     * such as above example, will be truncated to "AAAA0".
     */
    u8 name[NAME_MAX * MAX_ENTRIES];
#else
    /* If not fullpath, avoid transfer big data */
    char name[NAME_MAX];
#endif
    int flags; // EXTENDED_STRUCT_MEMBER
    u32 mode; // EXTENDED_STRUCT_MEMBER
};

BPF_RINGBUF_OUTPUT(events, BUFFER_PAGES);
"""

bpf_text_kprobe = """
BPF_HASH(infotmp, u64, struct val_t);

int trace_return(struct pt_regs *ctx)
{
    u64 id = bpf_get_current_pid_tgid();
    struct val_t *valp;
    struct data_t *data;

    u64 tsp = bpf_ktime_get_ns();

    valp = infotmp.lookup(&id);
    if (valp == 0) {
        // missed entry
        return 0;
    }

    data = events.ringbuf_reserve(sizeof(struct data_t));
    if (!data)
        goto cleanup;

    bpf_probe_read_kernel(&data->comm, sizeof(data->comm), valp->comm);
    data->path_depth = 0;
    bpf_probe_read_user_str(&data->name, sizeof(data->name), (void *)valp->fname);
    data->id = valp->id;
    data->ts = tsp / 1000;
    data->uid = bpf_get_current_uid_gid();
    data->flags = valp->flags; // EXTENDED_STRUCT_MEMBER
    data->mode = valp->mode; // EXTENDED_STRUCT_MEMBER
    data->ret = PT_REGS_RC(ctx);

    SUBMIT_DATA

cleanup:
    infotmp.delete(&id);

    return 0;
}
"""

bpf_text_kprobe_header_open = """
int syscall__trace_entry_open(struct pt_regs *ctx, const char __user *filename,
                              int flags, u32 mode)
{
"""

bpf_text_kprobe_header_openat = """
int syscall__trace_entry_openat(struct pt_regs *ctx, int dfd,
                                const char __user *filename, int flags,
                                u32 mode)
{
"""

bpf_text_kprobe_header_openat2 = """
#include <uapi/linux/openat2.h>
int syscall__trace_entry_openat2(struct pt_regs *ctx, int dfd, const char __user *filename, struct open_how *how)
{
    int flags = how->flags;
    u32 mode = 0;

    if (flags & O_CREAT || (flags & O_TMPFILE) == O_TMPFILE)
        mode = how->mode;
"""

bpf_text_kprobe_body = """
    struct val_t val = {};
    u64 id = bpf_get_current_pid_tgid();
    u32 pid = id >> 32; // PID is higher part
    u32 tid = id;       // Cast and get the lower part
    u32 uid = bpf_get_current_uid_gid();

    KPROBE_PID_TID_FILTER
    KPROBE_UID_FILTER
    KPROBE_FLAGS_FILTER

    if (container_should_be_filtered()) {
        return 0;
    }

    if (bpf_get_current_comm(&val.comm, sizeof(val.comm)) == 0) {
        val.id = id;
        val.fname = filename;
        val.flags = flags; // EXTENDED_STRUCT_MEMBER
        val.mode = mode; // EXTENDED_STRUCT_MEMBER
        infotmp.update(&id, &val);
    }

    return 0;
};
"""

bpf_text_kfunc_header_open = """
#if defined(CONFIG_ARCH_HAS_SYSCALL_WRAPPER) && !defined(__s390x__)
KRETFUNC_PROBE(FNNAME, struct pt_regs *regs, int ret)
{
    const char __user *filename = (char *)PT_REGS_PARM1(regs);
    int flags = PT_REGS_PARM2(regs);
    u32 mode = 0;

    /**
     * open(2): The mode argument must be supplied if O_CREAT or O_TMPFILE is
     * specified in flags; if it is not supplied, some arbitrary bytes from
     * the stack will be applied as the file mode.
     *
     * Other O_CREAT | O_TMPFILE checks about flags are also for this reason.
     */
    if (flags & O_CREAT || (flags & O_TMPFILE) == O_TMPFILE)
        mode = PT_REGS_PARM3(regs);
#else
KRETFUNC_PROBE(FNNAME, const char __user *filename, int flags,
               u32 mode, int ret)
{
#endif
"""

bpf_text_kfunc_header_openat = """
#if defined(CONFIG_ARCH_HAS_SYSCALL_WRAPPER) && !defined(__s390x__)
KRETFUNC_PROBE(FNNAME, struct pt_regs *regs, int ret)
{
    int dfd = PT_REGS_PARM1(regs);
    const char __user *filename = (char *)PT_REGS_PARM2(regs);
    int flags = PT_REGS_PARM3(regs);
    u32 mode = 0;

    if (flags & O_CREAT || (flags & O_TMPFILE) == O_TMPFILE)
        mode = PT_REGS_PARM4(regs);
#else
KRETFUNC_PROBE(FNNAME, int dfd, const char __user *filename, int flags,
               u32 mode, int ret)
{
#endif
"""

bpf_text_kfunc_header_openat2 = """
#include <uapi/linux/openat2.h>
#if defined(CONFIG_ARCH_HAS_SYSCALL_WRAPPER) && !defined(__s390x__)
KRETFUNC_PROBE(FNNAME, struct pt_regs *regs, int ret)
{
    int dfd = PT_REGS_PARM1(regs);
    const char __user *filename = (char *)PT_REGS_PARM2(regs);
    struct open_how __user how;
    int flags;
    u32 mode = 0;

    bpf_probe_read_user(&how, sizeof(struct open_how), (struct open_how*)PT_REGS_PARM3(regs));
    flags = how.flags;

    if (flags & O_CREAT || (flags & O_TMPFILE) == O_TMPFILE)
        mode = how.mode;
#else
KRETFUNC_PROBE(FNNAME, int dfd, const char __user *filename, struct open_how __user *how, int ret)
{
    int flags = how->flags;
    u32 mode = 0;

    if (flags & O_CREAT || (flags & O_TMPFILE) == O_TMPFILE)
        mode = how->mode;
#endif
"""

bpf_text_kfunc_body = """
    u64 id = bpf_get_current_pid_tgid();
    u32 pid = id >> 32; // PID is higher part
    u32 tid = id;       // Cast and get the lower part
    u32 uid = bpf_get_current_uid_gid();
    struct data_t *data;

    data = events.ringbuf_reserve(sizeof(struct data_t));
    if (!data)
        return 0;

    KFUNC_PID_TID_FILTER
    KFUNC_UID_FILTER
    KFUNC_FLAGS_FILTER
    if (container_should_be_filtered()) {
        events.ringbuf_discard(data, 0);
        return 0;
    }

    bpf_get_current_comm(&data->comm, sizeof(data->comm));

    u64 tsp = bpf_ktime_get_ns();

    data->path_depth = 0;
    bpf_probe_read_user_str(&data->name, sizeof(data->name), (void *)filename);
    data->id    = id;
    data->ts    = tsp / 1000;
    data->uid   = bpf_get_current_uid_gid();
    data->flags = flags; // EXTENDED_STRUCT_MEMBER
    data->mode  = mode; // EXTENDED_STRUCT_MEMBER
    data->ret   = ret;

    SUBMIT_DATA

    return 0;
}
"""

b = BPF(text='')
# open and openat are always in place since 2.6.16
fnname_open = b.get_syscall_prefix().decode() + 'open'
fnname_openat = b.get_syscall_prefix().decode() + 'openat'
fnname_openat2 = b.get_syscall_prefix().decode() + 'openat2'
if b.ksymname(fnname_openat2) == -1:
    fnname_openat2 = None
这里简单分析下绝对路径的提取实现,最终的结果是循环结束后,data->name缓冲区中将包含完整的绝对路径,data->path_depth记录了路径的深度,记住需要正确处理挂载点的场景
if args.full_path:
    bpf_text = bpf_text.replace('SUBMIT_DATA', """
    if (data->name[0] != '/') { // relative path
        //相对路径处理(路径的第一个字符是否为'/')
        struct task_struct *task;
        struct dentry *dentry, *parent_dentry, *mnt_root;
        struct vfsmount *vfsmnt;
        struct fs_struct *fs;
        struct path *path;
        struct mount *mnt;
        size_t filepart_length;
        //指向数据缓冲区,用于存储路径组件
        char *payload = data->name;
        struct qstr d_name;
        int i;

        //当前进程的task_struct
        task = (struct task_struct *)bpf_get_current_task_btf();

        fs = task->fs;
        path = &fs->pwd;    //pwd当前进程的工作目录
        dentry = path->dentry;  //fs->pwd->dentry
        vfsmnt = path->mnt;     //fs->pwd->mnt,挂载点

        mnt = container_of(vfsmnt, struct mount, mnt);

        //路径遍历循环
        //payload += NAME_MAX:初始化,将指针移动到缓冲区末尾
        for (i = 1, payload += NAME_MAX; i < MAX_ENTRIES; i++) {
            //循环处理每个路径组件,注意需要反向构建路径

            //读取当前dentry的名称到payload中
            // 先内核->ebpf,再ebpf->ebpf
            bpf_probe_read_kernel(&d_name, sizeof(d_name), &dentry->d_name);
            filepart_length =
                bpf_probe_read_kernel_str(payload, NAME_MAX, (void *)d_name.name);

            if (filepart_length < 0 || filepart_length > NAME_MAX)  //超限
                break;

            //2:获取父目录和挂载点根目录(从fs->pwd的mnt获取)
            bpf_probe_read_kernel(&mnt_root, sizeof(mnt_root), &vfsmnt->mnt_root);

            // 当前dentry的parent dentry
            bpf_probe_read_kernel(&parent_dentry, sizeof(parent_dentry), &dentry->d_parent);

            //3:检查是否到达边界条件
            if (dentry == parent_dentry || dentry == mnt_root) {
                //处理挂载点边界,边界条件判断如下:
                //case1:dentry == parent_dentry,到达根目录(根目录的parent指向本身)
                // PS: 这个根目录不一定是系统的/,也有可能是当前子树的/
                //case2:dentry == mnt_root,到达当前挂载点的根目录
                struct mount *mnt_parent;
                bpf_probe_read_kernel(&mnt_parent, sizeof(mnt_parent), &mnt->mnt_parent);

                //4:挂载点处理
                if (mnt != mnt_parent) {
                    // 切换到父挂载点
                    // 当跨越挂载点时,需要切换到父挂载点继续遍历

                    // 重要:将当前dentry切换为上一级dentry树对应的节点
                    bpf_probe_read_kernel(&dentry, sizeof(dentry), &mnt->mnt_mountpoint);

                    // 重要:挂载树切换
                    mnt = mnt_parent;
                    vfsmnt = &mnt->mnt;
                    // 继续处理
                    bpf_probe_read_kernel(&mnt_root, sizeof(mnt_root), &vfsmnt->mnt_root);

                    data->path_depth++;
                    payload += NAME_MAX;
                    continue;
                } else {
                    //mnt == mnt_parent
                    /* Real root directory */
                    //到达真正的根目录,跳出循环
                    // 说明已经到达了系统的最顶层根目录,不需要继续向上遍历,路径解析完成
                    break;
                }
            }

            //5:正常目录遍历,移动到下一个目录项,增加路径深度计数
            payload += NAME_MAX;

            dentry = parent_dentry;
            data->path_depth++;
        }
    }

    events.ringbuf_submit(data, sizeof(*data));
    """)
else:
    bpf_text = bpf_text.replace('SUBMIT_DATA', """
    events.ringbuf_submit(data, sizeof(*data));
    """)