0x00 前言
本文的出发点是希望在 gRPC 的框架中,加入核心数据监控的能力(Monitoring),目前预研的库有两个:
- prometheus
- open-falcon
这篇文章,介绍下如何将 gRPC 和 Prometheus 结合。Prometheus 的架构中常用的是 Pull 模式,当然 Push 也可以。这其实就是服务端(服务注册)和客户端(主动上报数据)的区别。在 Pull 模式中, 通过 HTTP 协议去采集指标,只要应用系统能够提供 HTTP 接口(一般使用 promhttp 创建 HttpServer)就可以接入监控系统,相比于私有协议或二进制协议来说更为简单。
相关基础知识介绍:理解 Prometheus 的基本数据类型及应用(基础篇)
0x01 Prometheus Metrics
Metrics 类型
Prometheus 常用 4 种 Metric 类型,前四种为:Counter,Gauge,Summary 和 Histogram,每种类型都有对应的 Vector 版本:GaugeVec, CounterVec, SummaryVec, HistogramVec。Vector 版本细化了 prometheus 数据模型,增加了 label 维度。现网项目中Vector形式更为常用。
0x02 Prometheus 包的用法
Prometheus 包提供了用于实现监控代码的 Metric 原型和用于注册 Metric 的 Registry。Promhttp 允许通过 HTTP 来暴露注册的 Metric 或将注册的 Metric 推送到 Pushgateway。
在 Prometheus 中,一般 Metric 对象采集的使用步骤如下:
- 初始化一个 Metric 对象
- Register 注册对象,常用
MustRegister方法注册 - 向对象中添加值
常用类型及方法
// 该类型实现了 error 接口,由 Register 返回,用于判断用于注册的 collector 是否已经被注册过
type AlreadyRegisteredError
// 用于采集 prometheus metric,如果运行多个相同的实例,则需要使用 ConstLabels 来注册这些实例。实现 collector 接口需要实现 Describe 和 Collect 方法,并注册 collector
type Collector
// 负责 collector 的注册和去注册,实现 custom registrer 时应该实现该接口
type Registerer

// 使用 DefaultRegisterer 来注册传入的 Collector
func Register(c Collector) error
// 使用 DefaultRegisterer 来移除传入的 Collector 的注册信息
func Unregister(c Collector) bool
此外,带 Must 的版本函数只是对不带 Must 函数的封装,增加了 panic 操作,如:
// MustRegister implements Registerer.
func (r *Registry) MustRegister(cs ...Collector) {
    for _, c := range cs {
        if err := r.Register(c); err != nil {
            panic(err)
        }
    }
}
0x03 Counter && CounterVec
计数器(Counter)是表示单个单调递增计数器的累积量,其值只能增加或在重启时重置为零。 例如,可以使用计数器来表示服务的总请求数,已完成的任务或错误总数。 但是注意不要使用计数器来监控可能减少的值。CounterVec 是一组 Counter,这些计数器具有相同的描述,但它们的变量标签具有不同的值。 如果要计算按各种维度划分的相同内容(例如,响应代码和方法分区的 HTTP 请求数),则使用此方法。使用 NewCounterVec 创建实例。
Counter 主要两个方法,Inc 和 Add,
Inc()   // 将 counter 值加 1
Add(float64)    // 将指定值加到 counter 值上,如果指定值 < 0 会 panic
Counter 使用例子
// 初始化一个 Counter
pushCounter = prometheus.NewCounter(prometheus.CounterOpts{
    Name: "repository_pushes",
    Help: "Number of pushes to external repository.",   // 注意,必须要定义 Help,否则会报错
})

// 注册
err = prometheus.Register(pushCounter)
if err != nil {
    fmt.Println("Push counter couldn't be registered AGAIN, no counting will happen:", err)
    return
}

collectChan := make(chan struct{})

for range collectChan {
    // 向对象中写入(统计)值
    pushCounter.Inc()
}
CounterVec 使用例子
同样的,建立 CounterVec 也遵循同样的三部曲:
// 第一步:建立 NewCounterVec,注意指定 label 为 slice 数组
httpReqs := prometheus.NewCounterVec(
    prometheus.CounterOpts{
        Name: "http_requests_total",
        Help: "How many HTTP requests processed, partitioned by status code and HTTP method.",
    },
    []string{"code", "method"},
)
// 第二步: 注册
prometheus.MustRegister(httpReqs)

// 调用 Add() 写入
httpReqs.WithLabelValues("404", "POST").Add(42)

// If you have to access the same set of labels very frequently, it
// might be good to retrieve the metric only once and keep a handle to
// it. But beware of deletion of that metric, see below!
// 第三步:写入值,调用 Inc() 写入
m := httpReqs.WithLabelValues("200", "GET")
for i := 0; i < 1000000; i++ {
    m.Inc()
}
// Delete a metric from the vector. If you have previously kept a handle
// to that metric (as above), future updates via that handle will go
// unseen (even if you re-create a metric with the same label set
// later).
httpReqs.DeleteLabelValues("200", "GET")
// Same thing with the more verbose Labels syntax.
httpReqs.Delete(prometheus.Labels{"method": "GET", "code": "200"})
0x04 Gauge && GaugeVec
Gauge 可以用来存放一个可以任意变大变小的数值,通常用于测量值,例如 CPU-core 使用率或内存使用情况,或者运行的 goroutine 数量;如果需要一次性统计 N 个 cpu-core 的使用率,这个时候就适合使用 GaugeVec 来完成
Gauge 主要有以下四个方法:
// 将 Gauge 中的值设为指定值
Set(float64)
// 将 Gauge 中的值加 1
Inc()
// 将 Gauge 中的值减 1
Dec()
// 将指定值加到 Gauge 中的值上。(指定值可以为负数)
Add(float64)
// 将指定值从 Gauge 中的值减掉。(指定值可以为负数)
Sub(float64)
Gauge 使用例子
// 初始化
cpuUsage := prometheus.NewGauge(prometheus.GaugeOpts{
    Name:      "CPU_Usage",
    Help:      "the Usage of CPU",
})
// 注册
prometheus.MustRegister(cpuUsage)
// 定时获取 cpu 温度并且写入到容器
func(){
    tem = getCpuCurrentUsage()
    // 向 cpuUsage 中写入值,调用 Set 方法
	cpuUsage.Set(tem)
}
GaugeVec 使用例子
cpulistUsage := prometheus.NewGaugeVec(
    prometheus.GaugeOpts{
        Name:      "CPUs_Usage",
        Help:      "the Usage of ALL CPUs.",
    },
    []string{
        "cpuName",
    },
)
prometheus.MustRegister(cpulistUsage)

cpulistUsage.WithLabelValues("cpu1").Set(cpu1_usage)
cpulistUsage.WithLabelValues("cpu2").Set(cpu2_usage)
cpulistUsage.WithLabelValues("cpu3").Set(cpu3_usage)
cpulistUsage.WithLabelValues("cpu4").Set(cpu4_usage)
0x05 Histogram
Histogram 主要用于表示一段时间范围内对数据进行采样,(通常是请求持续时间或响应大小),并能够对其指定区间以及总数进行统计,通常我们用它计算分位数的直方图。
temps := prometheus.NewHistogram(prometheus.HistogramOpts{
    Name:    "pond_temperature_celsius",
    Help:    "The temperature of the frog pond.", // Sorry, we can't measure how badly it smells.
    Buckets: prometheus.LinearBuckets(20, 5, 5),  // 5 buckets, each 5 centigrade wide.
})

// Simulate some observations.
for i := 0; i < 1000; i++ {
    temps.Observe(30 + math.Floor(120*math.Sin(float64(i)*0.1))/10)
}

// Just for demonstration, let's check the state of the histogram by
// (ab)using its Write method (which is usually only used by Prometheus
// internally).
metric := &dto.Metric{}
temps.Write(metric)
fmt.Println(proto.MarshalTextString(metric))
0x06 Summary
Summary 从事件或样本流中捕获单个观察,并以类似于传统汇总统计的方式对其进行汇总:1。观察总和,2。观察计数,3。排名估计。典型的用例是观察请求延迟。 默认情况下,Summary 提供延迟的中位数。
temps := prometheus.NewSummary(prometheus.SummaryOpts{
    Name:       "pond_temperature_celsius",
    Help:       "The temperature of the frog pond.",
    Objectives: map[float64]float64{0.5: 0.05, 0.9: 0.01, 0.99: 0.001},
})

// Simulate some observations.
for i := 0; i < 1000; i++ {
    temps.Observe(30 + math.Floor(120*math.Sin(float64(i)*0.1))/10)
}

// Just for demonstration, let's check the state of the summary by
// (ab)using its Write method (which is usually only used by Prometheus
// internally).
metric := &dto.Metric{}
temps.Write(metric)
fmt.Println(proto.MarshalTextString(metric))
0x07 gRPC 与 Prometheus 结合
这小节,以 PULL 方式为例,看下如何在 gRPC 中通过 prometheus 实现监控。基本的框架如下:
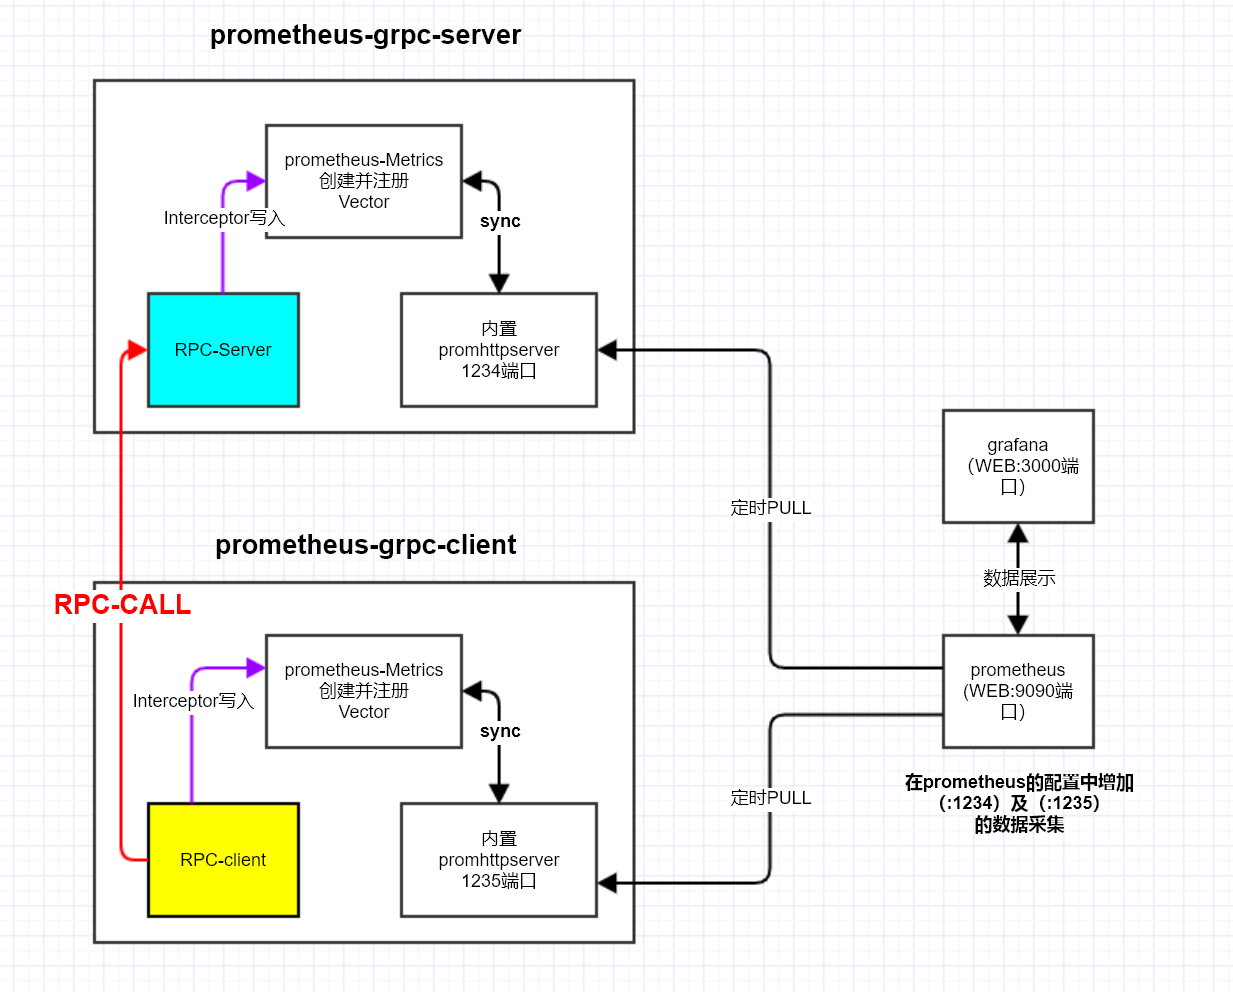
go-grpc-prometheus 是 gRPC 生态中最常用的 Prometheus 监控库,它通过 gRPC 拦截器(Interceptor)自动采集 Server 端和 Client 端的核心指标。该库默认采集的 Server 端指标包括:
grpc_server_started_total(Counter):gRPC 服务收到的请求总数,按grpc_type/grpc_service/grpc_method分维度grpc_server_handled_total(Counter):gRPC 服务处理完成的请求总数,包含grpc_code标签grpc_server_msg_received_total(Counter):服务端接收的消息总数(Streaming 场景有用)grpc_server_msg_sent_total(Counter):服务端发送的消息总数grpc_server_handling_seconds(Histogram):请求处理耗时分布(需显式开启)
Server 端接入
package main

import (
	"context"
	"log"
	"net"
	"net/http"

	grpc_prometheus "github.com/grpc-ecosystem/go-grpc-prometheus"
	"github.com/prometheus/client_golang/prometheus"
	"github.com/prometheus/client_golang/prometheus/promhttp"
	"google.golang.org/grpc"

	pb "your_project/proto"
)

type server struct {
	pb.UnimplementedYourServiceServer
}

func (s *server) SayHello(ctx context.Context, req *pb.HelloRequest) (*pb.HelloReply, error) {
	return &pb.HelloReply{Message: "Hello " + req.Name}, nil
}

func main() {
	lis, err := net.Listen("tcp", ":50051")
	if err != nil {
		log.Fatalf("failed to listen: %v", err)
	}

	// 自定义 histogram bucket(可选)
	grpc_prometheus.EnableHandlingTimeHistogram(
		grpc_prometheus.WithHistogramBuckets([]float64{0.001, 0.005, 0.01, 0.025, 0.05, 0.1, 0.25, 0.5, 1, 2.5, 5}),
	)

	grpcServer := grpc.NewServer(
		grpc.StreamInterceptor(grpc_prometheus.StreamServerInterceptor),
		grpc.UnaryInterceptor(grpc_prometheus.UnaryServerInterceptor),
	)

	pb.RegisterYourServiceServer(grpcServer, &server{})

	// 注册 grpc-prometheus 的 Server 端指标
	grpc_prometheus.Register(grpcServer)

	// 启动 Prometheus HTTP 端口暴露指标
	go func() {
		httpMux := http.NewServeMux()
		httpMux.Handle("/metrics", promhttp.Handler())
		log.Println("Prometheus metrics server listening on :9092")
		if err := http.ListenAndServe(":9092", httpMux); err != nil {
			log.Fatalf("metrics server failed: %v", err)
		}
	}()

	log.Println("gRPC server listening on :50051")
	if err := grpcServer.Serve(lis); err != nil {
		log.Fatalf("failed to serve: %v", err)
	}
}
关键点说明:
grpc_prometheus.EnableHandlingTimeHistogram()必须在创建 gRPC Server 之前调用,用于开启grpc_server_handling_secondsHistogram 指标(默认不开启)grpc_prometheus.Register(grpcServer)会自动为所有已注册的 gRPC service 初始化0值指标,避免在 Prometheus 中出现指标缺失- Server 端拦截器需要同时注册
UnaryServerInterceptor和StreamServerInterceptor
Client 端接入
package main

import (
	"context"
	"log"
	"time"

	grpc_prometheus "github.com/grpc-ecosystem/go-grpc-prometheus"
	"google.golang.org/grpc"
	"google.golang.org/grpc/credentials/insecure"

	pb "your_project/proto"
)

func main() {
	conn, err := grpc.Dial("localhost:50051",
		grpc.WithTransportCredentials(insecure.NewCredentials()),
		grpc.WithUnaryInterceptor(grpc_prometheus.UnaryClientInterceptor),
		grpc.WithStreamInterceptor(grpc_prometheus.StreamClientInterceptor),
	)
	if err != nil {
		log.Fatalf("did not connect: %v", err)
	}
	defer conn.Close()

	client := pb.NewYourServiceClient(conn)
	ctx, cancel := context.WithTimeout(context.Background(), 5*time.Second)
	defer cancel()

	resp, err := client.SayHello(ctx, &pb.HelloRequest{Name: "world"})
	if err != nil {
		log.Fatalf("could not greet: %v", err)
	}
	log.Printf("Greeting: %s", resp.Message)
}
Client 端采集的指标与 Server 端类似,前缀为 grpc_client_*,包括 grpc_client_started_total、grpc_client_handled_total、grpc_client_handling_seconds 等
自定义指标扩展
在 go-grpc-prometheus 基础上,可以通过注册额外的自定义 CounterVec 来扩展监控维度(如按业务错误码统计):
var (
	customGrpcErrors = prometheus.NewCounterVec(
		prometheus.CounterOpts{
			Name: "grpc_custom_errors_total",
			Help: "Custom business error counter for gRPC",
		},
		[]string{"grpc_service", "grpc_method", "biz_code"},
	)
)

func init() {
	prometheus.MustRegister(customGrpcErrors)
}

func (s *server) SayHello(ctx context.Context, req *pb.HelloRequest) (*pb.HelloReply, error) {
	resp, bizErr := s.doBusinessLogic(req)
	if bizErr != nil {
		customGrpcErrors.WithLabelValues("YourService", "SayHello", bizErr.Code).Inc()
	}
	return resp, nil
}
常用 gRPC PromQL 查询
# gRPC 服务整体 QPS
sum(rate(grpc_server_handled_total[5m]))

# 按方法分组的 QPS
sum(rate(grpc_server_handled_total[5m])) by (grpc_method)

# gRPC 错误率(非 OK 状态码)
sum(rate(grpc_server_handled_total{grpc_code!="OK"}[5m]))
  /
sum(rate(grpc_server_handled_total[5m]))

# 按方法分组的 P99 延迟
histogram_quantile(0.99,
  sum(rate(grpc_server_handling_seconds_bucket[5m])) by (le, grpc_method)
)

# 全局平均延迟
sum(rate(grpc_server_handling_seconds_sum[5m]))
  /
sum(rate(grpc_server_handling_seconds_count[5m]))
0x08 gRPC的metrics设计(思考)
指标
为了实时了解和监控gRPC服务的运行状况,需要重点关注如下指标:
- RPC接口请求耗时:
server_elapsed_ms - 服务器错误:
server_errors - 请求字节数:
server_bytes_transferred_in - 回包字节数:
server_bytes_transferred_out - 服务器状态码:
server_code
接下来,就是把上面的指标按照Prometheus的metrics表现出来:
- Counter:代表一种样本数据单调递增的指标,即只增不减,通常用来统计如服务的请求数,错误数等
- Gauge:代表一种样本数据可以任意变化的指标,即可增可减,通常用来统计如服务的CPU使用值,内存占用值等
- Histogram和Summary:用于表示一段时间内的数据采样和点分位图统计结果,通常用来统计请求耗时或响应大小等
label设计
- 组织(realm)
- 地域(region)
- 可用区域(available-zone)
- 发布环境(dev/beta/prod)
- 应用名称(appname)
- 主机名称(hostname)
- 方法(method)
- 返回码(retcode)
- 版本(app-version)
指标结合label所形成的多维度时间序列是各个维度监控/metrics的基础。
0x09 gRPC的metrics采集
本小节梳理下,如何利用gRPC拦截器简化Metrics的采集过程。考虑Metrics统计和Metrics采集两个逻辑的实现,参考项目go-grpc-prometheus
Metrics统计
Metrics的来源可能有如下两种。基于interceptor,可以在每一次请求前后都增加对应统计或处理:
- 服务自身的metrics
- 服务作为Metrics转换器,接收客户端上报的Metrics并转发(类似PUSH-GATEWAY的功能)
Metrics采集(PULL or PUSH)
服务完成metrics数据收集(转换)后,需要把数据上报到Prometheus服务器中:
1、主动拉取:服务侧提供接口暴露Metrics数据
func StartPrometheus(port, path string) *http.Server {
    //......
	if len(path) < 1 || !strings.HasPrefix(path, "/") {
		// Invalid, use default
		path = DefaultPath
	}

	// Register
	prometheus.Register(Collector1)
    prometheus.Register(Collector2)
    prometheus.Register(Collector3)

	httpMux := http.NewServeMux()
	httpMux.Handle(path, promhttp.Handler())

	server := &http.Server{
		Addr: "0.0.0.0:" + port,
		Handler: httpMux,
	}

	go func() {
		server.ListenAndServe()
	}()

	return server
}
此外,通过声明Prometheus配置文件中的scrape_configs选项,指定Prometheus在运行时需要拉取指标的目标:
# A scrape configuration containing exactly one endpoint to scrape.
scrape_configs:
  # 配置服务地址
  - job_name: 'test-application-metrics'
    scrape_interval: 2s
    static_configs:
      - targets: ['localhost:12345']
2、被动接收(PUSH模式)
主动拉取模式不一定适用所有场景,比如因防护墙限制无法提供采集服务,又或者定期对目标节点进行抓数据采集,可能存在任务节点还没来得及被拉取就运行完退出,导致数据丢失。为此,笔者封装了基于Prometheus提供了Pushgateway用于接收来自服务的主动上报接口,示例代码如下:
publisher := py_prom.NewPushGatewayPublisher(5*time.Second,prom_address)

publisher.Start()

guages := py_prom.ListGuage()
for i := range guages {
	publisher.AddCollector(guages[i])
}
counters := py_prom.ListCounter()
for i := range counters {
	publisher.AddCollector(counters[i])
}

histograms := py_prom.ListHistogram()
for i := range histograms {
	publisher.AddCollector(histograms[i])
}

summay := py_prom.ListSummary()
for i := range summay {
	publisher.AddCollector(summay[i])
}
prometheus的配置如下,配置成pushgateway的地址用于Prometheus拉取:
# A scrape configuration containing exactly one endpoint to scrape.
scrape_configs:
  - job_name: 'pushgateway'
    scrape_interval: 10s
    honor_labels: true
    static_configs:
      - targets: ['pushgateway:9091']